BEN_MCDHUI


Location

lon / lat [deg]: 27.6175 / -30.7108

Source network: AERONET


Geostationary surface albedo (GSA) data


“+000”


“+057/+063”


Landcover information (based on ESA CCI landcover data)


Landcover fractions @ 2km distance


Landcover fractions @ 20 km distance


Legend


Distance to open water bodies [km]:

3.76

Distance to urban areas [km]:

27.83


Radius: 1 km

Number of landcover classes:

1

Dominant landcover type:

130: grassland

Fraction of dominant landcover type [%]:

100.0


Radius: 2 km

Number of landcover classes:

3

Dominant landcover type:

130: grassland

Fraction of dominant landcover type [%]:

91.0


Radius: 5 km

Number of landcover classes:

3

Dominant landcover type:

130: grassland

Fraction of dominant landcover type [%]:

77.0


Radius: 10 km

Number of landcover classes:

4

Dominant landcover type:

130: grassland

Fraction of dominant landcover type [%]:

77.0


Radius: 20 km

Number of landcover classes:

5

Dominant landcover type:

130: grassland

Fraction of dominant landcover type [%]:

77.0


Disturbances


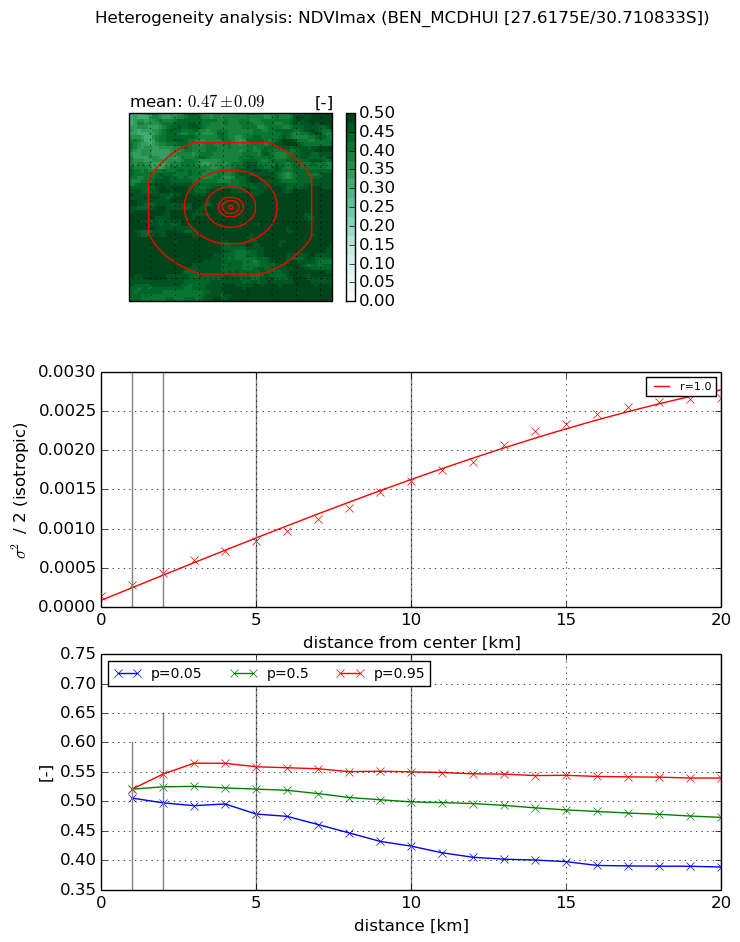
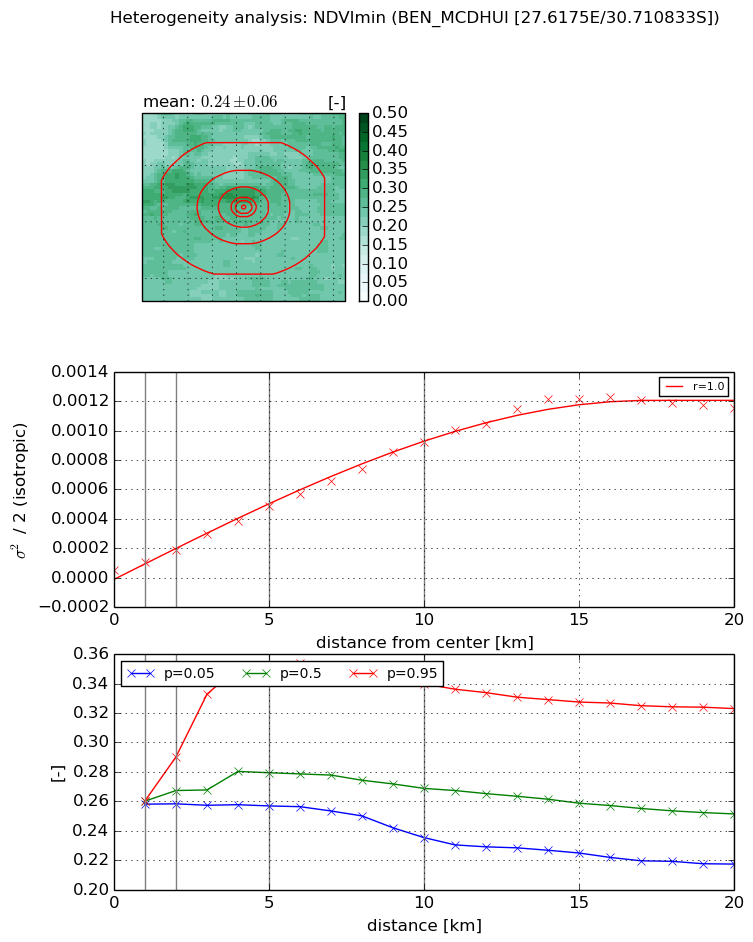
Heterogeneity analysis

The heterogeneity analysis provides information about the spatial and temporal heterogeneity of the site.

Topography


Roman et al. (2009) index


St

10.7756301279

Rcv

0.242913554193

Rse

0.0

Rst

-0.0351924972307

Rsv

-0.000299941022116


Height range @ 1km [m]

408

Height range @ 2km [m]

402

Height range @ 5km [m]

566

Height range @ 10km [m]

-999

Height range @ 20km [m]

-999


Variance slope @ 1 km

15666

Variance slope @ 2 km

15036

Variance slope @ 5 km

7441

Variance slope @ 10 km

-999

Variance slope @ 20 km

-999


NDVI (max. NDVI composite)


Roman et al. (2009) index


St

3.93855042221

Rcv

0.057915797162

Rse

0.0

Rst

-3.50516398797e-08

Rsv

-0.7037857276


NDVI range @ 1km [-]

0.02

NDVI range @ 2km [-]

0.05

NDVI range @ 5km [-]

0.08

NDVI range @ 10km [-]

0.13

NDVI range @ 20km [-]

0.15


Variance slope @ 1 km

0.000138551576118

Variance slope @ 2 km

0.000147335137548

Variance slope @ 5 km

0.000143374210289

Variance slope @ 10 km

0.000144436786034

Variance slope @ 20 km

0.000136462474904


NDVI (min. NDVI composite)I


Roman et al. (2009) index


St

3.00142422642

Rcv

0.277255282018

Rse

0.0

Rst

-0.228475165793

Rsv

0.493795035322


NDVI range @ 1km [-]

0.0

NDVI range @ 2km [-]

0.03

NDVI range @ 5km [-]

0.09

NDVI range @ 10km [-]

0.1

NDVI range @ 20km [-]

0.11


NDVI slope @ 1 km

5.68270732418e-05

NDVI slope @ 2 km

6.70036930784e-05

NDVI slope @ 5 km

8.87185073755e-05

NDVI slope @ 10 km

9.01090879381e-05

NDVI slope @ 20 km

6.31196282803e-05


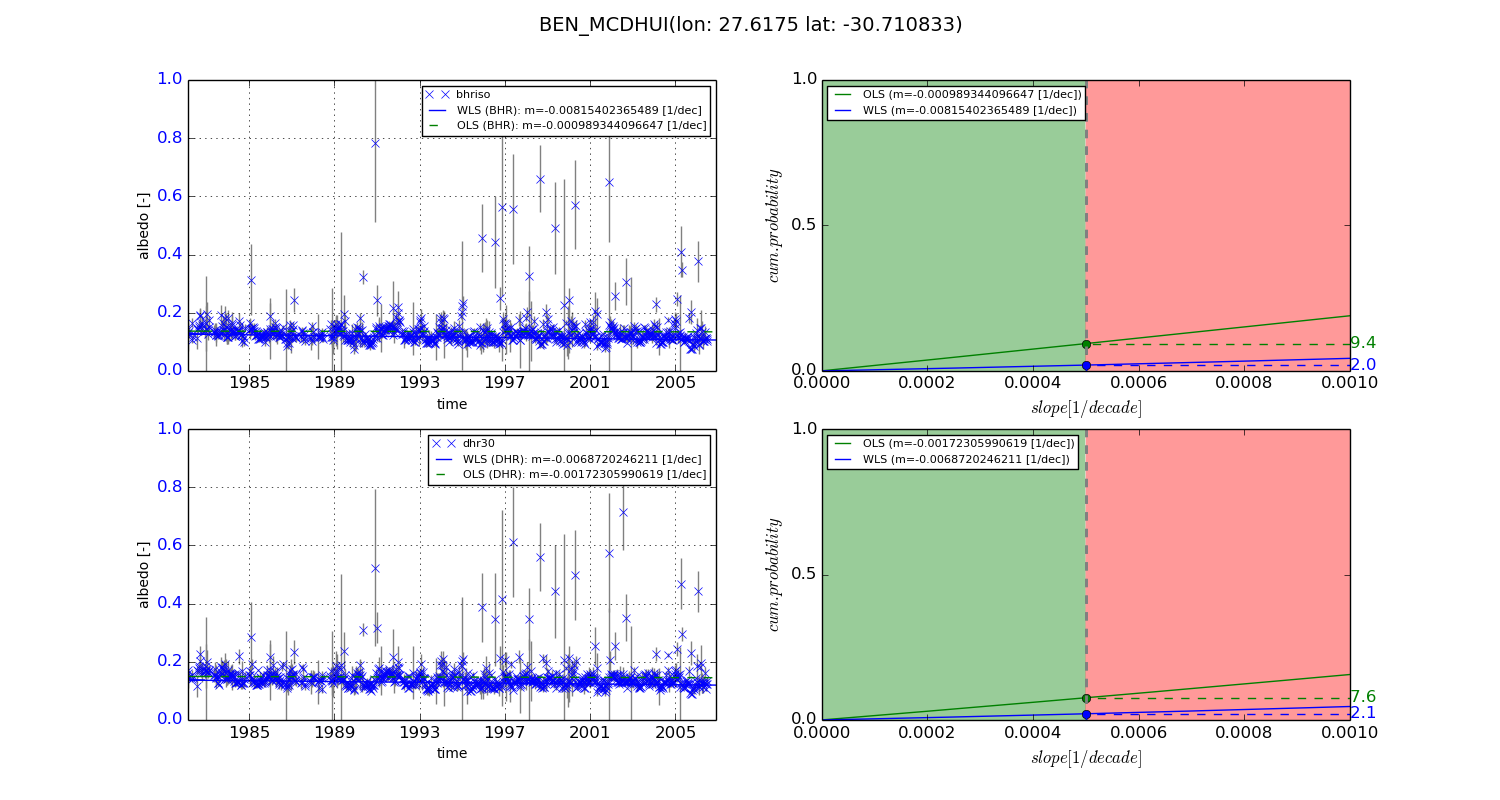
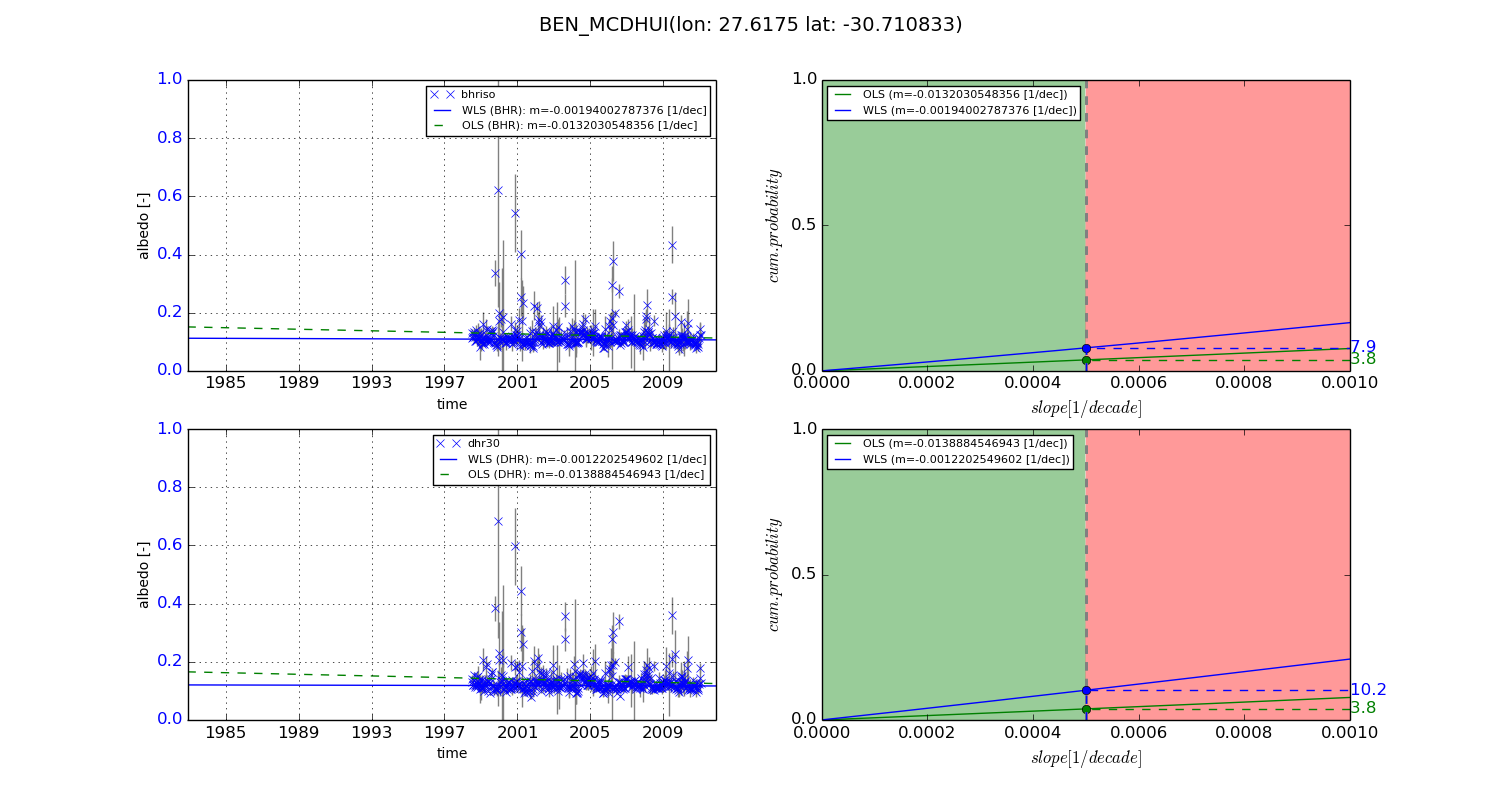
Temporal stability analysis

+000 deg (BHR)


BHR statistics

Temporal stability [1/decade]:


abs

rel


Weighted least square:

-0.00815402365489


Ordinary least square:

-0.000989344096647


Probabilities that GCOS criteria is met:

Weighted least square:

2.0 %

Ordinary least square:

9.4 %


DHR statistics

Temporal stability [1/decade]:


abs

rel


Weighted least square:

-0.0068720246211


Ordinary least square:

-0.00172305990619


Probabilities that GCOS criteria is met:

Weighted least square:

2.1 %

Ordinary least square:

7.6 %


+057/+063 deg (BHR)


BHR statistics

Temporal stability [1/decade]:


abs

rel


Weighted least square:

-0.00194002787376


Ordinary least square:

-0.0132030548356


Probabilities that GCOS criteria is met:

Weighted least square:

7.9 %

Ordinary least square:

3.8 %


DHR statistics

Temporal stability [1/decade]:


abs

rel


Weighted least square:

-0.0012202549602


Ordinary least square:

-0.0138884546943


Probabilities that GCOS criteria is met:

Weighted least square:

10.2 %

Ordinary least square:

3.8 %


Temporal anomaly analyis

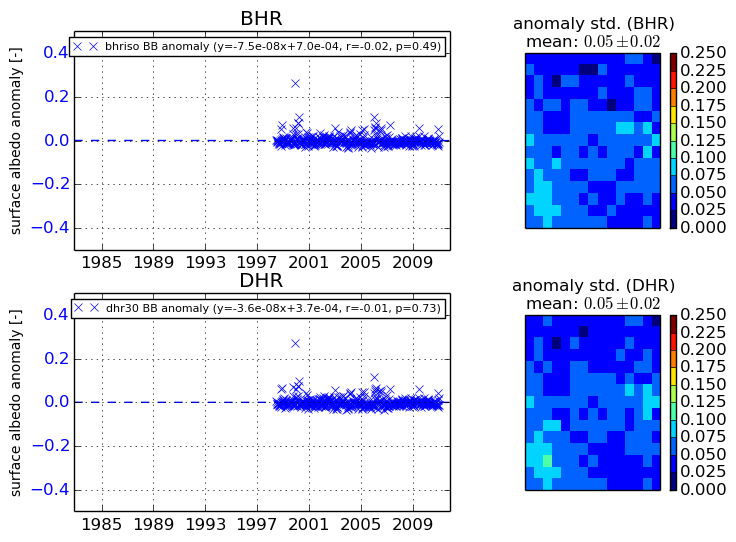
The variance of the temporal anomalies provides an additional measure about the stability of the signal AFTER removal of the mean seasonal cylce.
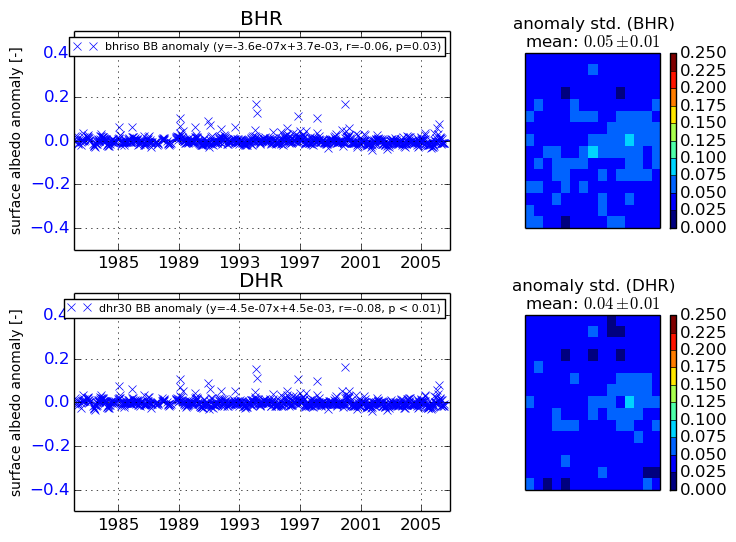
+000 deg


+057/+063 deg