BEN_SALEM


Location

lon / lat [deg]: 9.914 / 35.5506

Source network: AERONET


Geostationary surface albedo (GSA) data


“+000”


“+057/+063”


Landcover information (based on ESA CCI landcover data)


Landcover fractions @ 2km distance


Landcover fractions @ 20 km distance


Legend


Distance to open water bodies [km]:

15.09

Distance to urban areas [km]:

13.45


Radius: 1 km

Number of landcover classes:

2

Dominant landcover type:

150: Sparse vegetation (tree, shrub, herbaceous cover) (<15%)

Fraction of dominant landcover type [%]:

68.0


Radius: 2 km

Number of landcover classes:

2

Dominant landcover type:

150: Sparse vegetation (tree, shrub, herbaceous cover) (<15%)

Fraction of dominant landcover type [%]:

59.0


Radius: 5 km

Number of landcover classes:

3

Dominant landcover type:

150: Sparse vegetation (tree, shrub, herbaceous cover) (<15%)

Fraction of dominant landcover type [%]:

61.0


Radius: 10 km

Number of landcover classes:

3

Dominant landcover type:

150: Sparse vegetation (tree, shrub, herbaceous cover) (<15%)

Fraction of dominant landcover type [%]:

48.0


Radius: 20 km

Number of landcover classes:

3

Dominant landcover type:

150: Sparse vegetation (tree, shrub, herbaceous cover) (<15%)

Fraction of dominant landcover type [%]:

55.0


Disturbances


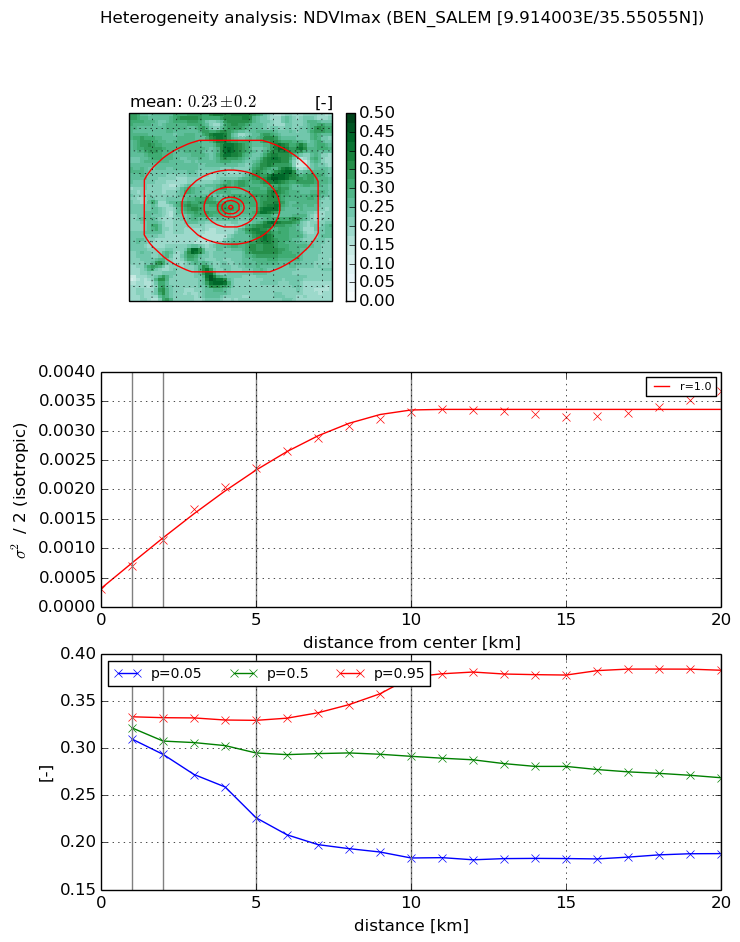
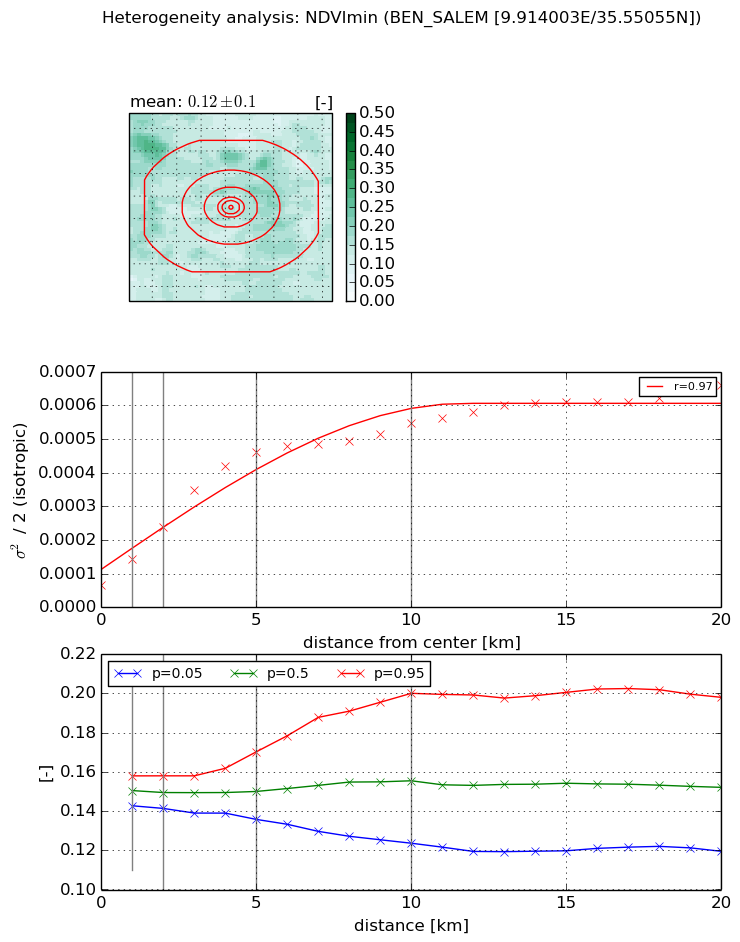
Heterogeneity analysis

The heterogeneity analysis provides information about the spatial and temporal heterogeneity of the site.

Topography


Roman et al. (2009) index


St

0.00155775006114

Rcv

1.06000362771

Rse

0.0

Rst

1.60513359828e-05

Rsv

1924.79450272


Height range @ 1km [m]

8

Height range @ 2km [m]

13

Height range @ 5km [m]

36

Height range @ 10km [m]

-999

Height range @ 20km [m]

-999


Variance slope @ 1 km

20

Variance slope @ 2 km

30

Variance slope @ 5 km

38

Variance slope @ 10 km

-999

Variance slope @ 20 km

-999


NDVI (max. NDVI composite)


Roman et al. (2009) index


St

2.81334470563

Rcv

0.784120694779

Rse

0.0

Rst

0.0824713275682

Rsv

0.199754378077


NDVI range @ 1km [-]

0.02

NDVI range @ 2km [-]

0.04

NDVI range @ 5km [-]

0.1

NDVI range @ 10km [-]

0.19

NDVI range @ 20km [-]

0.19


Variance slope @ 1 km

0.00038332753401

Variance slope @ 2 km

0.00041404016972

Variance slope @ 5 km

0.000423909680855

Variance slope @ 10 km

0.000308087091774

Variance slope @ 20 km

0.000135919535425


NDVI (min. NDVI composite)I


Roman et al. (2009) index


St

1.79925918334

Rcv

0.609168036374

Rse

0.0

Rst

0.0581851200626

Rsv

-0.999999734008


NDVI range @ 1km [-]

0.02

NDVI range @ 2km [-]

0.02

NDVI range @ 5km [-]

0.03

NDVI range @ 10km [-]

0.08

NDVI range @ 20km [-]

0.08


NDVI slope @ 1 km

7.96277029606e-05

NDVI slope @ 2 km

8.63767831043e-05

NDVI slope @ 5 km

8.33993225212e-05

NDVI slope @ 10 km

4.54956563143e-05

NDVI slope @ 20 km

2.38511824032e-05


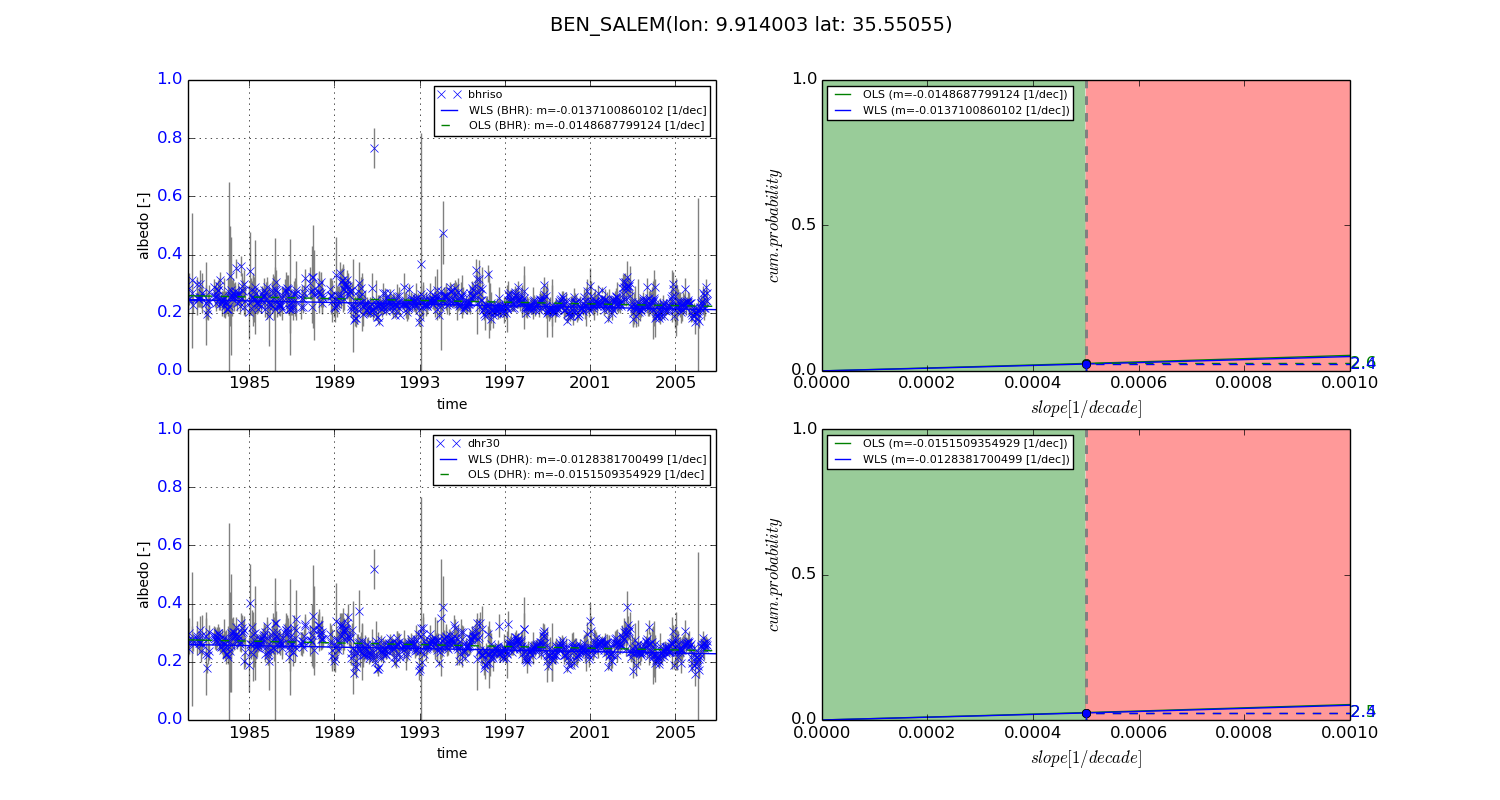
Temporal stability analysis

+000 deg (BHR)


BHR statistics

Temporal stability [1/decade]:


abs

rel


Weighted least square:

-0.0137100860102


Ordinary least square:

-0.0148687799124


Probabilities that GCOS criteria is met:

Weighted least square:

2.4 %

Ordinary least square:

2.6 %


DHR statistics

Temporal stability [1/decade]:


abs

rel


Weighted least square:

-0.0128381700499


Ordinary least square:

-0.0151509354929


Probabilities that GCOS criteria is met:

Weighted least square:

2.4 %

Ordinary least square:

2.5 %


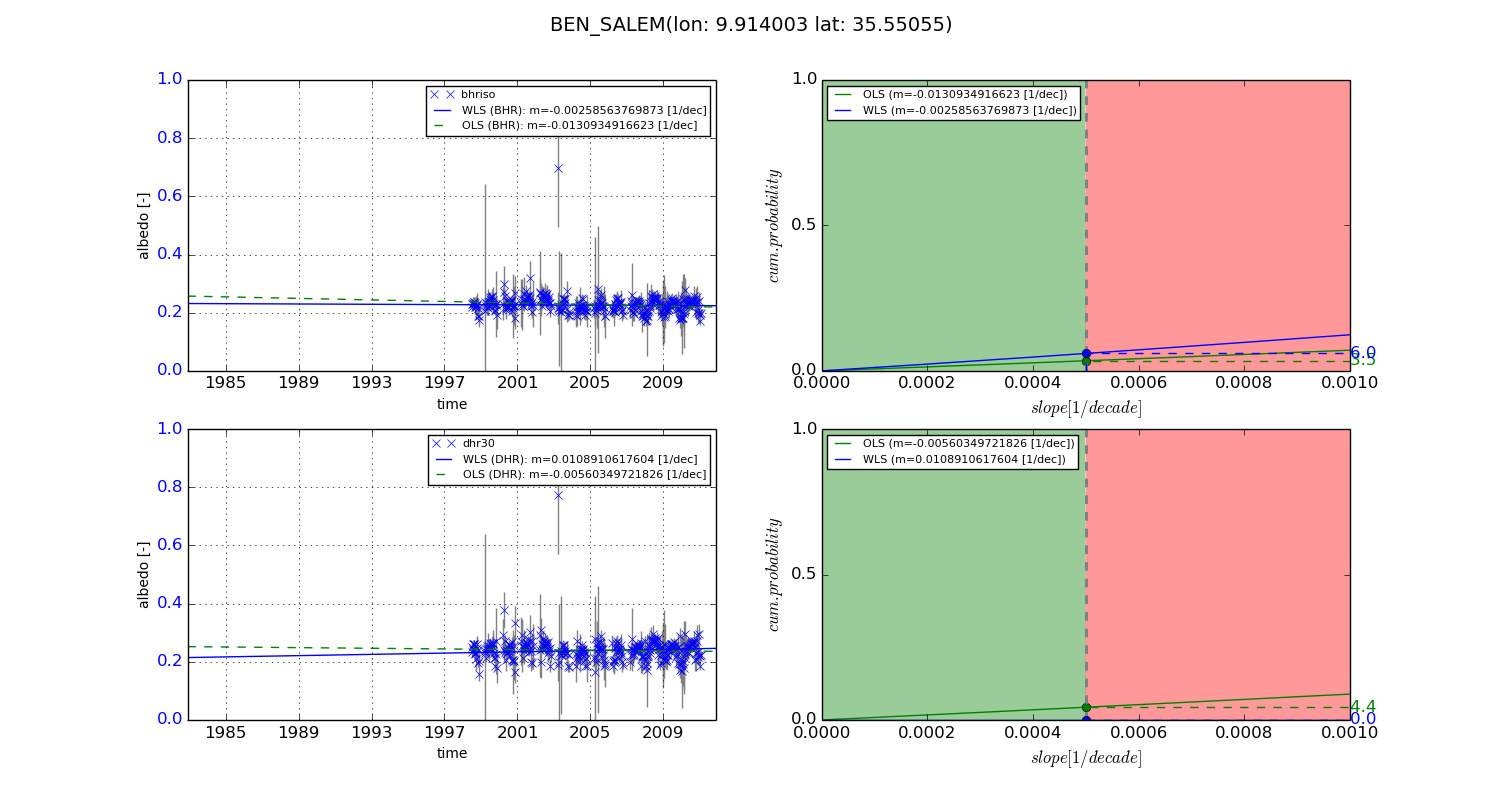
+057/+063 deg (BHR)


BHR statistics

Temporal stability [1/decade]:


abs

rel


Weighted least square:

-0.00258563769873


Ordinary least square:

-0.0130934916623


Probabilities that GCOS criteria is met:

Weighted least square:

6.0 %

Ordinary least square:

3.5 %


DHR statistics

Temporal stability [1/decade]:


abs

rel


Weighted least square:

0.0108910617604


Ordinary least square:

-0.00560349721826


Probabilities that GCOS criteria is met:

Weighted least square:

0.0 %

Ordinary least square:

4.4 %


Temporal anomaly analyis

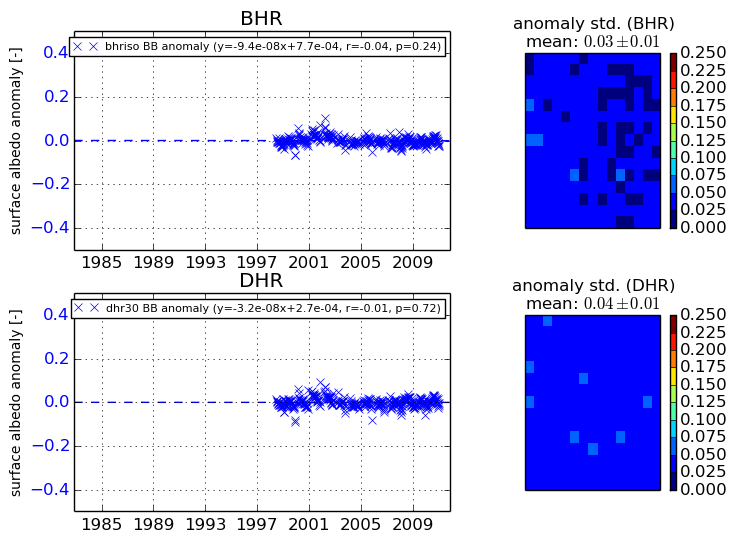
The variance of the temporal anomalies provides an additional measure about the stability of the signal AFTER removal of the mean seasonal cylce.
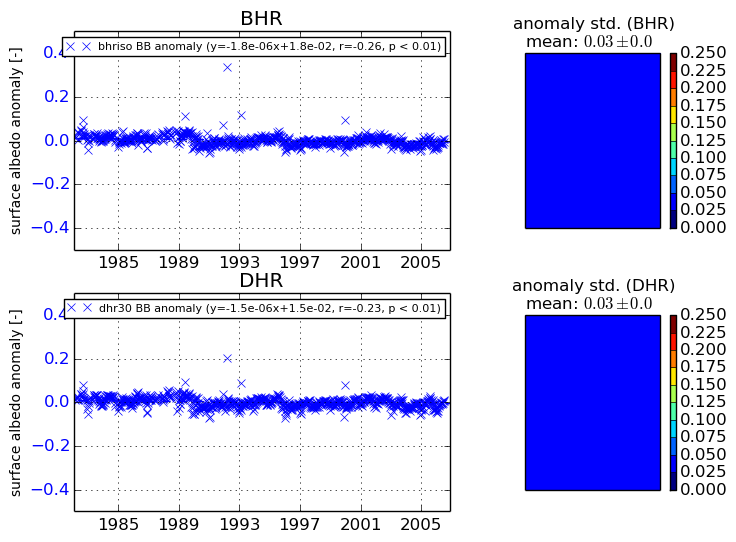
+000 deg


+057/+063 deg