BETHLEHEM


Location

lon / lat [deg]: 28.3333 / -28.2483

Source network: AERONET


Geostationary surface albedo (GSA) data


“+000”


“+057/+063”


Landcover information (based on ESA CCI landcover data)


Landcover fractions @ 2km distance


Landcover fractions @ 20 km distance


Legend


Distance to open water bodies [km]:

2.02

Distance to urban areas [km]:

0.31


Radius: 1 km

Number of landcover classes:

3

Dominant landcover type:

190: urban areas

Fraction of dominant landcover type [%]:

57.0


Radius: 2 km

Number of landcover classes:

4

Dominant landcover type:

10: cropland, rainfed

Fraction of dominant landcover type [%]:

47.0


Radius: 5 km

Number of landcover classes:

5

Dominant landcover type:

10: cropland, rainfed

Fraction of dominant landcover type [%]:

48.0


Radius: 10 km

Number of landcover classes:

5

Dominant landcover type:

10: cropland, rainfed

Fraction of dominant landcover type [%]:

73.0


Radius: 20 km

Number of landcover classes:

4

Dominant landcover type:

10: cropland, rainfed

Fraction of dominant landcover type [%]:

83.0


Disturbances


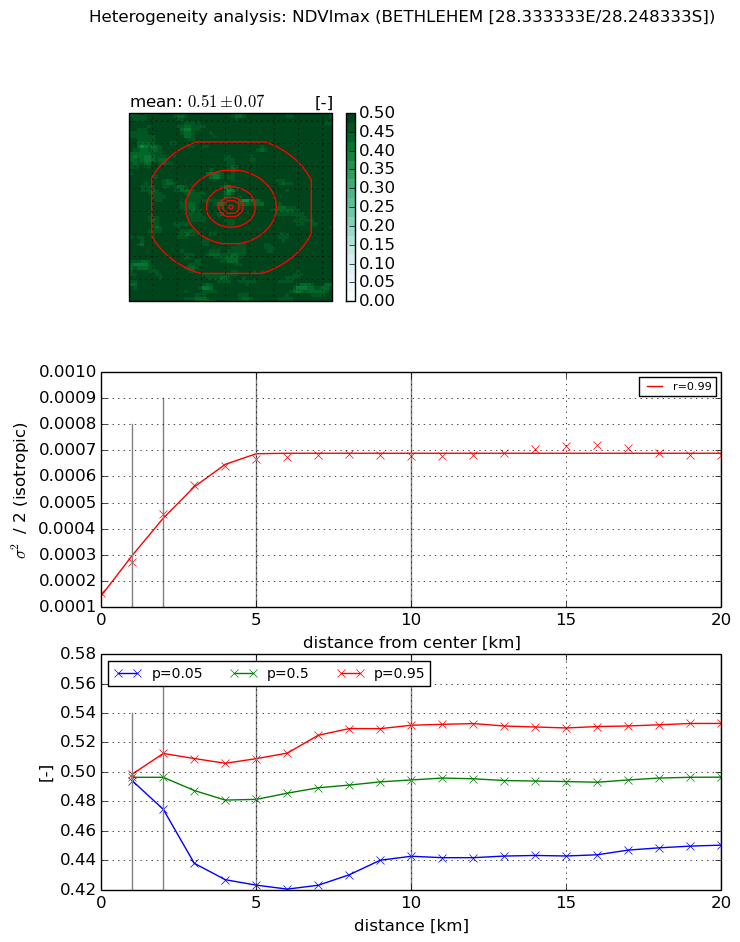
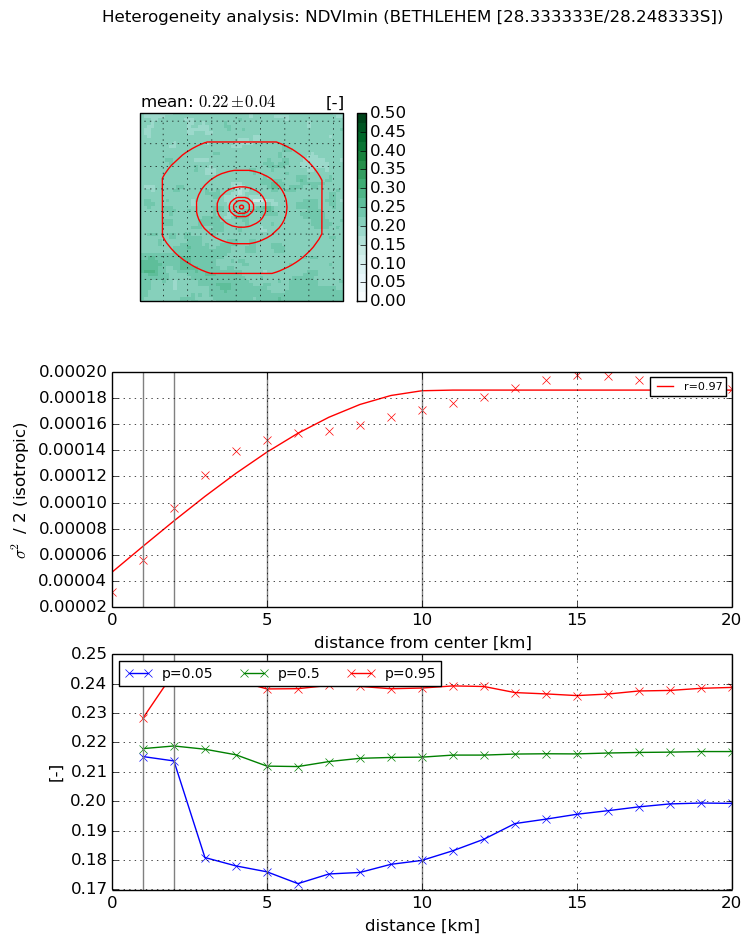
Heterogeneity analysis

The heterogeneity analysis provides information about the spatial and temporal heterogeneity of the site.

Topography


Roman et al. (2009) index


St

4.2540855675

Rcv

0.150944266747

Rse

0.0

Rst

0.099334974428

Rsv

-0.454925191694


Height range @ 1km [m]

27

Height range @ 2km [m]

63

Height range @ 5km [m]

113

Height range @ 10km [m]

-999

Height range @ 20km [m]

-999


Variance slope @ 1 km

603

Variance slope @ 2 km

567

Variance slope @ 5 km

251

Variance slope @ 10 km

-999

Variance slope @ 20 km

-999


NDVI (max. NDVI composite)


Roman et al. (2009) index


St

2.47444914296

Rcv

0.214041313669

Rse

0.0

Rst

-0.414979101366

Rsv

-0.583370637146


NDVI range @ 1km [-]

0.0

NDVI range @ 2km [-]

0.04

NDVI range @ 5km [-]

0.09

NDVI range @ 10km [-]

0.09

NDVI range @ 20km [-]

0.08


Variance slope @ 1 km

0.000117660758275

Variance slope @ 2 km

0.000151849546769

Variance slope @ 5 km

0.000107851963356

Variance slope @ 10 km

4.73647153402e-05

Variance slope @ 20 km

1.64088246467e-05


NDVI (min. NDVI composite)I


Roman et al. (2009) index


St

1.52350431439

Rcv

0.200835702638

Rse

0.0

Rst

-1.734393827

Rsv

0.0339148775455


NDVI range @ 1km [-]

0.01

NDVI range @ 2km [-]

0.03

NDVI range @ 5km [-]

0.06

NDVI range @ 10km [-]

0.06

NDVI range @ 20km [-]

0.04


NDVI slope @ 1 km

2.47015026823e-05

NDVI slope @ 2 km

3.20556337663e-05

NDVI slope @ 5 km

2.44997585826e-05

NDVI slope @ 10 km

1.27723412579e-05

NDVI slope @ 20 km

6.38752827361e-06


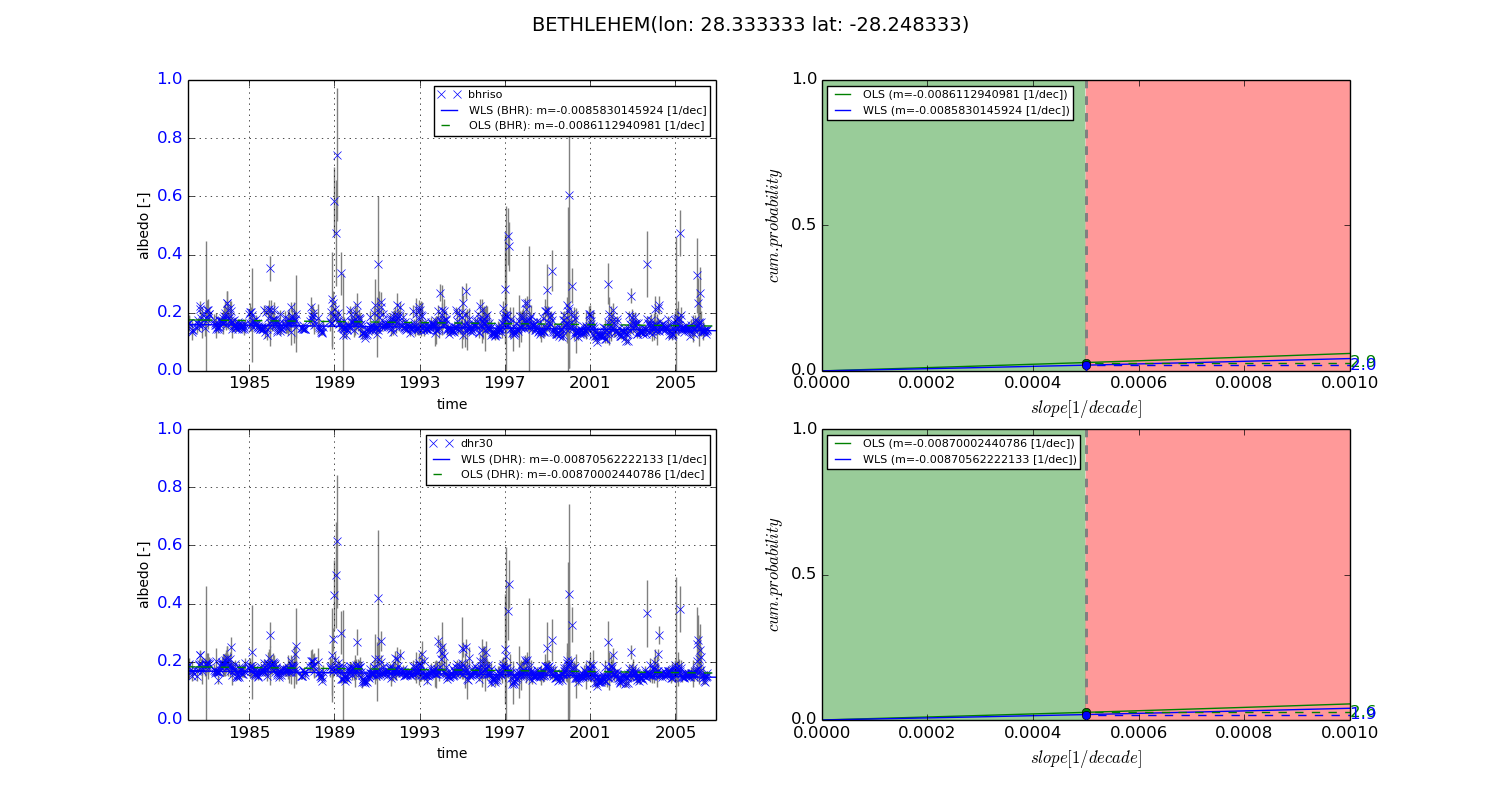
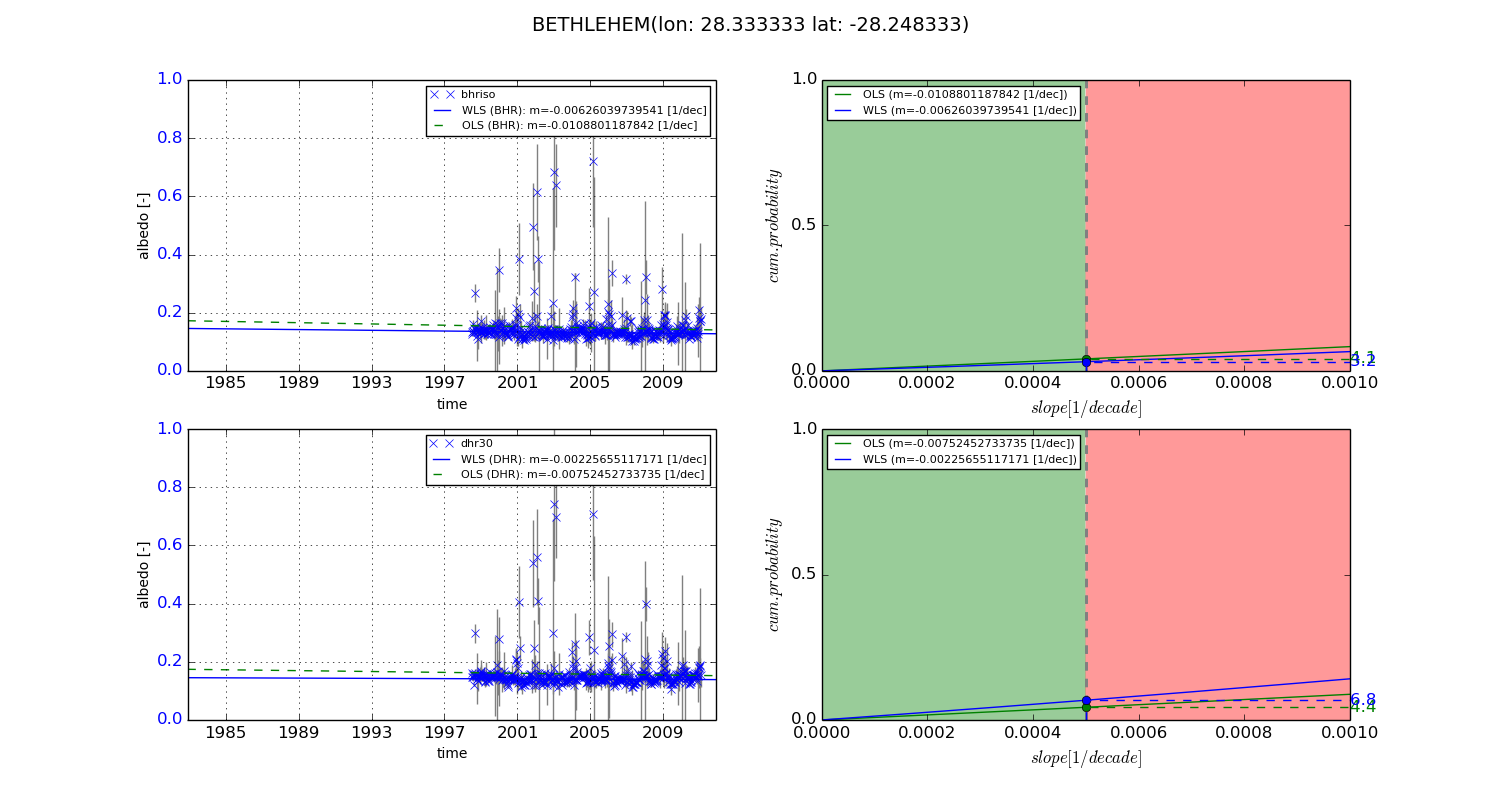
Temporal stability analysis

+000 deg (BHR)


BHR statistics

Temporal stability [1/decade]:


abs

rel


Weighted least square:

-0.0085830145924


Ordinary least square:

-0.0086112940981


Probabilities that GCOS criteria is met:

Weighted least square:

2.0 %

Ordinary least square:

2.9 %


DHR statistics

Temporal stability [1/decade]:


abs

rel


Weighted least square:

-0.00870562222133


Ordinary least square:

-0.00870002440786


Probabilities that GCOS criteria is met:

Weighted least square:

1.9 %

Ordinary least square:

2.6 %


+057/+063 deg (BHR)


BHR statistics

Temporal stability [1/decade]:


abs

rel


Weighted least square:

-0.00626039739541


Ordinary least square:

-0.0108801187842


Probabilities that GCOS criteria is met:

Weighted least square:

3.2 %

Ordinary least square:

4.1 %


DHR statistics

Temporal stability [1/decade]:


abs

rel


Weighted least square:

-0.00225655117171


Ordinary least square:

-0.00752452733735


Probabilities that GCOS criteria is met:

Weighted least square:

6.8 %

Ordinary least square:

4.4 %


Temporal anomaly analyis

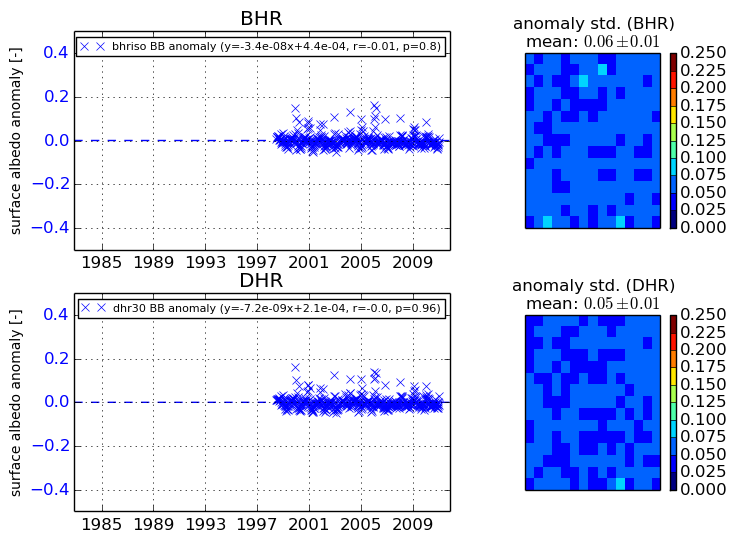
The variance of the temporal anomalies provides an additional measure about the stability of the signal AFTER removal of the mean seasonal cylce.
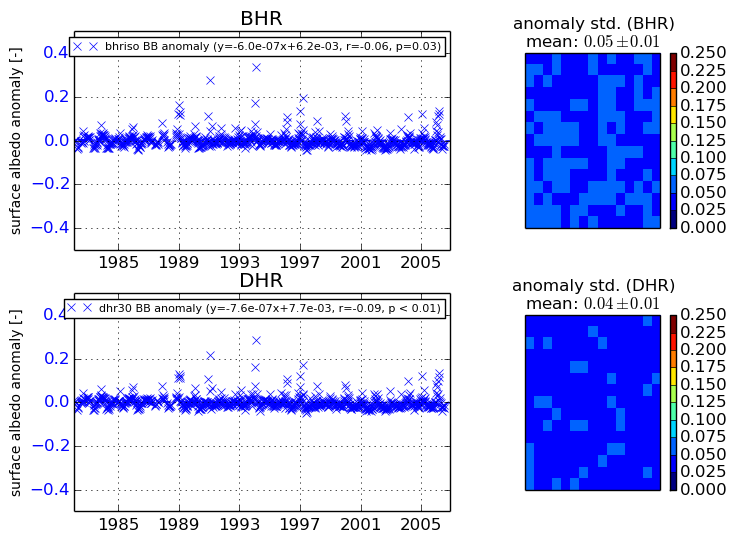
+000 deg


+057/+063 deg