BIDI_BAHN


Location

lon / lat [deg]: -2.45 / 14.06

Source network: AERONET


Geostationary surface albedo (GSA) data


“+000”


“+057/+063”


Landcover information (based on ESA CCI landcover data)


Landcover fractions @ 2km distance


Landcover fractions @ 20 km distance


Legend


Distance to open water bodies [km]:

23.78

Distance to urban areas [km]:

2.56


Radius: 1 km

Number of landcover classes:

2

Dominant landcover type:

10: cropland, rainfed

Fraction of dominant landcover type [%]:

59.0


Radius: 2 km

Number of landcover classes:

2

Dominant landcover type:

10: cropland, rainfed

Fraction of dominant landcover type [%]:

56.0


Radius: 5 km

Number of landcover classes:

5

Dominant landcover type:

130: grassland

Fraction of dominant landcover type [%]:

46.0


Radius: 10 km

Number of landcover classes:

5

Dominant landcover type:

130: grassland

Fraction of dominant landcover type [%]:

47.0


Radius: 20 km

Number of landcover classes:

5

Dominant landcover type:

10: cropland, rainfed

Fraction of dominant landcover type [%]:

49.0


Disturbances


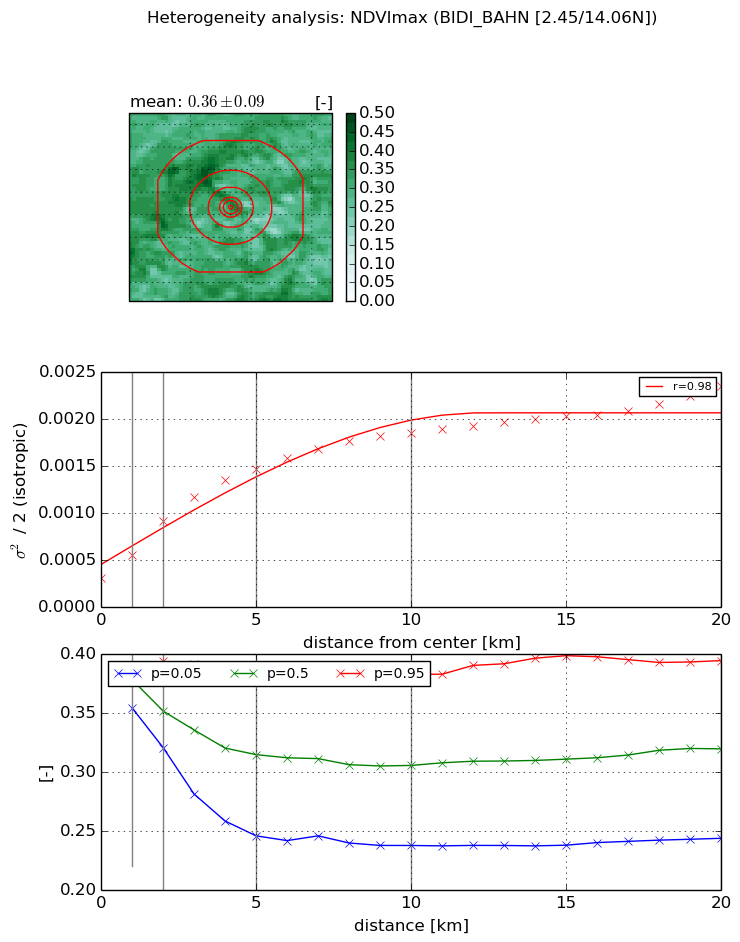
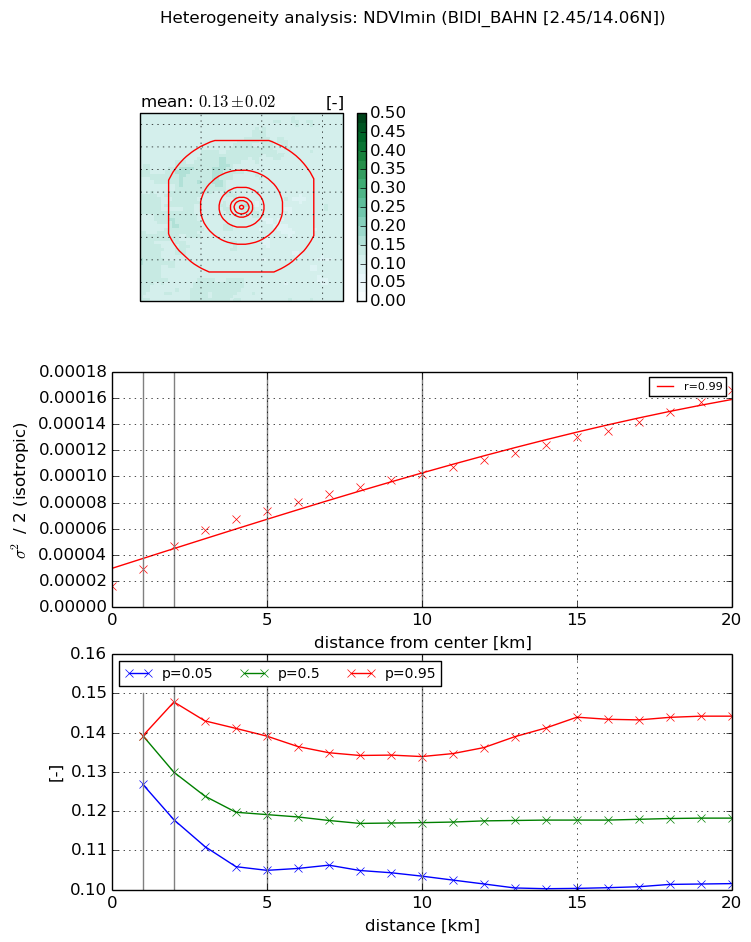
Heterogeneity analysis

The heterogeneity analysis provides information about the spatial and temporal heterogeneity of the site.

Topography


Roman et al. (2009) index


St

2.63789116032

Rcv

0.137225324525

Rse

0.0

Rst

-5.07361390767e-05

Rsv

-0.999996031958


Height range @ 1km [m]

12

Height range @ 2km [m]

17

Height range @ 5km [m]

22

Height range @ 10km [m]

-999

Height range @ 20km [m]

-999


Variance slope @ 1 km

10

Variance slope @ 2 km

13

Variance slope @ 5 km

13

Variance slope @ 10 km

-999

Variance slope @ 20 km

-999


NDVI (max. NDVI composite)


Roman et al. (2009) index


St

6.84897932756

Rcv

0.251181413219

Rse

0.0

Rst

-0.0375776234627

Rsv

0.149262434332


NDVI range @ 1km [-]

0.03

NDVI range @ 2km [-]

0.07

NDVI range @ 5km [-]

0.14

NDVI range @ 10km [-]

0.15

NDVI range @ 20km [-]

0.15


Variance slope @ 1 km

0.000250429547247

Variance slope @ 2 km

0.000303324869459

Variance slope @ 5 km

0.000241702252913

Variance slope @ 10 km

0.000150875219202

Variance slope @ 20 km

8.03246109498e-05


NDVI (min. NDVI composite)I


Roman et al. (2009) index


St

8.80711389473

Rcv

0.0294840247086

Rse

0.0

Rst

0.194288813435

Rsv

0.116860885441


NDVI range @ 1km [-]

0.01

NDVI range @ 2km [-]

0.03

NDVI range @ 5km [-]

0.03

NDVI range @ 10km [-]

0.03

NDVI range @ 20km [-]

0.04


NDVI slope @ 1 km

1.28868650744e-05

NDVI slope @ 2 km

1.52243176277e-05

NDVI slope @ 5 km

1.18711111745e-05

NDVI slope @ 10 km

8.21286034852e-06

NDVI slope @ 20 km

6.55583497882e-06


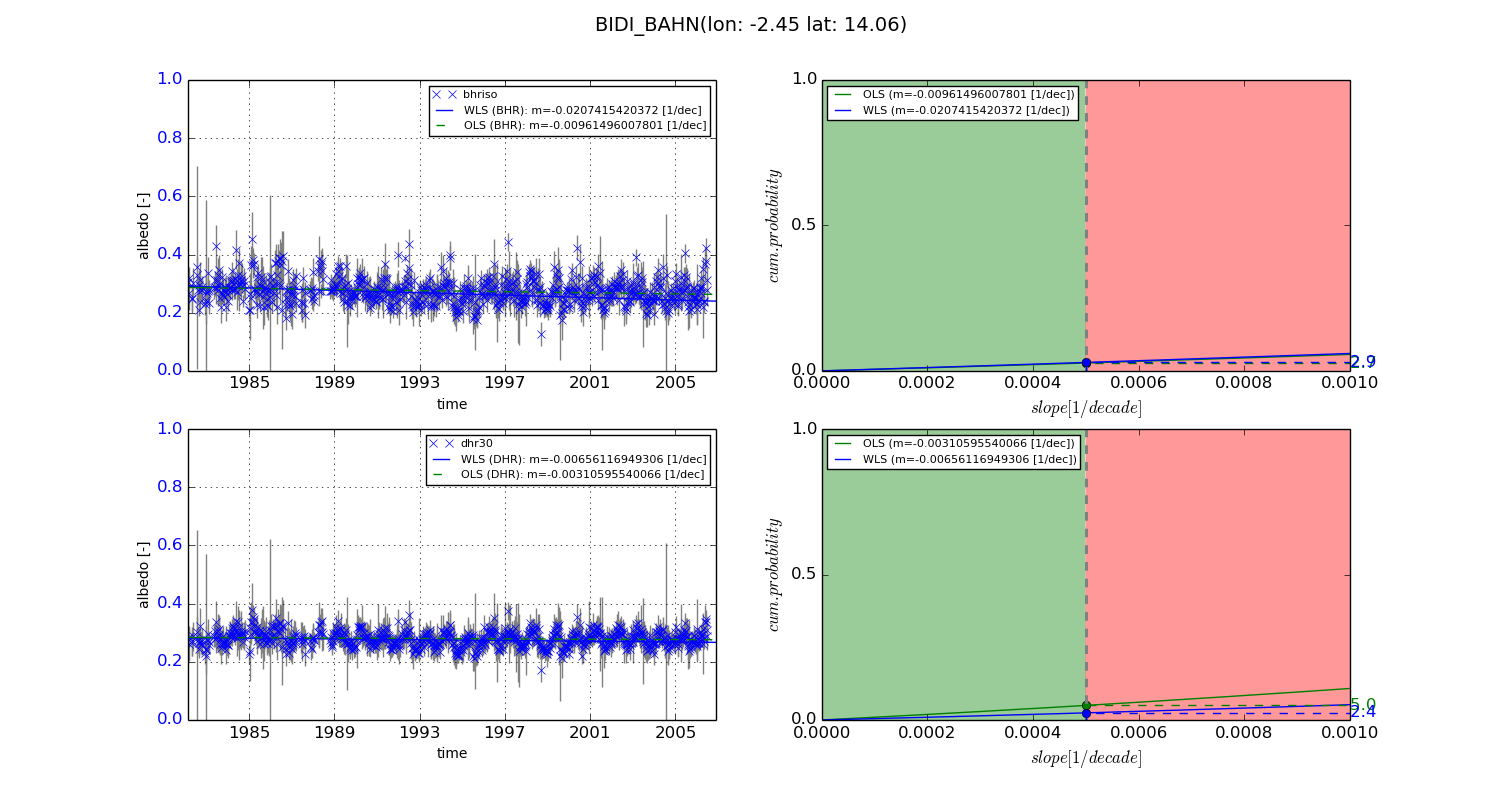
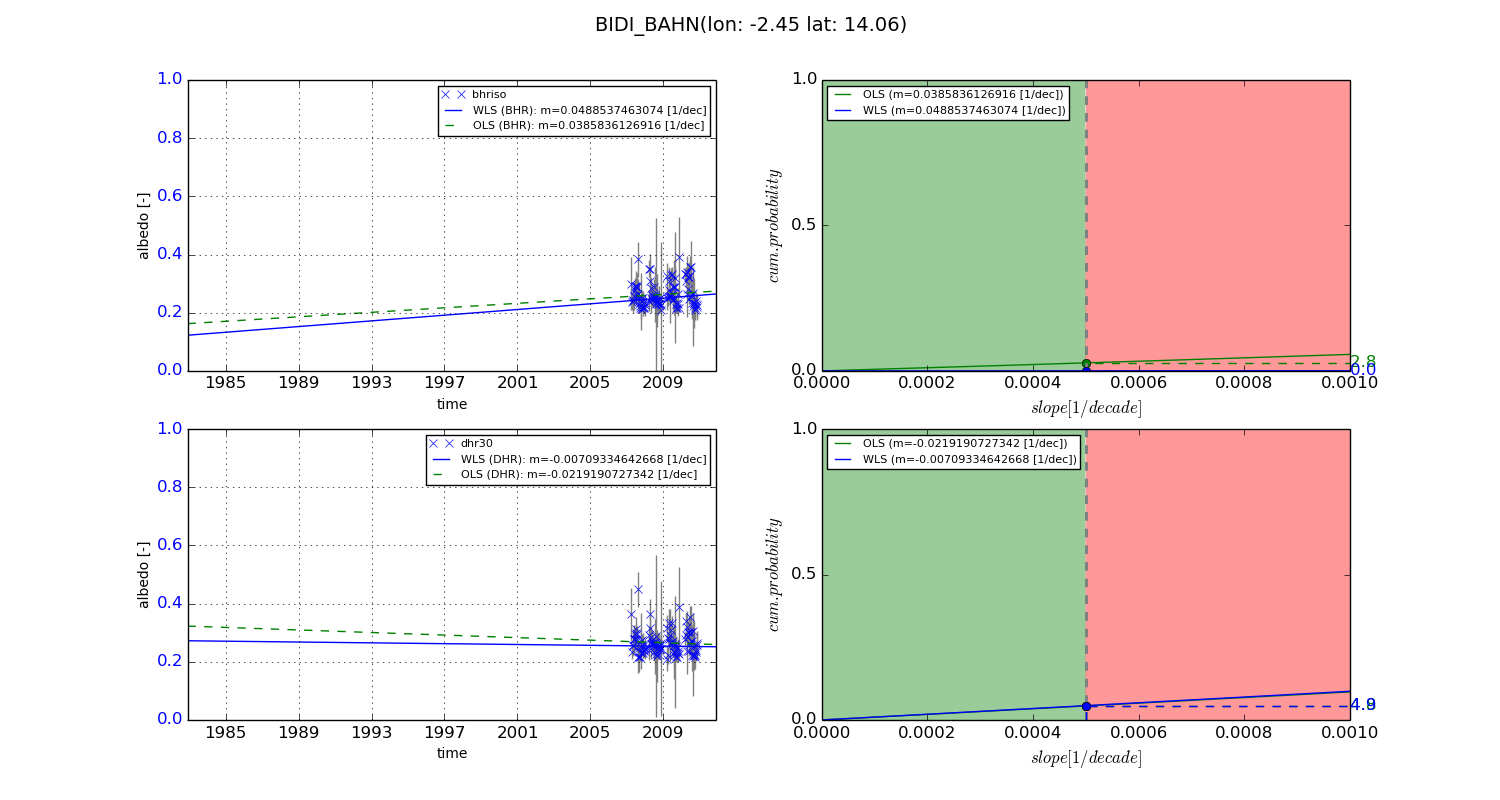
Temporal stability analysis

+000 deg (BHR)


BHR statistics

Temporal stability [1/decade]:


abs

rel


Weighted least square:

-0.0207415420372


Ordinary least square:

-0.00961496007801


Probabilities that GCOS criteria is met:

Weighted least square:

2.9 %

Ordinary least square:

2.7 %


DHR statistics

Temporal stability [1/decade]:


abs

rel


Weighted least square:

-0.00656116949306


Ordinary least square:

-0.00310595540066


Probabilities that GCOS criteria is met:

Weighted least square:

2.4 %

Ordinary least square:

5.0 %


+057/+063 deg (BHR)


BHR statistics

Temporal stability [1/decade]:


abs

rel


Weighted least square:

0.0488537463074


Ordinary least square:

0.0385836126916


Probabilities that GCOS criteria is met:

Weighted least square:

0.0 %

Ordinary least square:

2.8 %


DHR statistics

Temporal stability [1/decade]:


abs

rel


Weighted least square:

-0.00709334642668


Ordinary least square:

-0.0219190727342


Probabilities that GCOS criteria is met:

Weighted least square:

4.9 %

Ordinary least square:

4.8 %


Temporal anomaly analyis

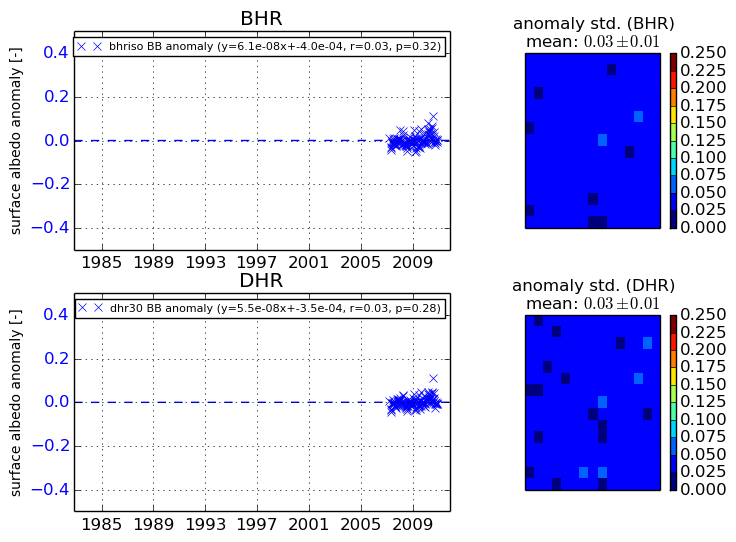
The variance of the temporal anomalies provides an additional measure about the stability of the signal AFTER removal of the mean seasonal cylce.
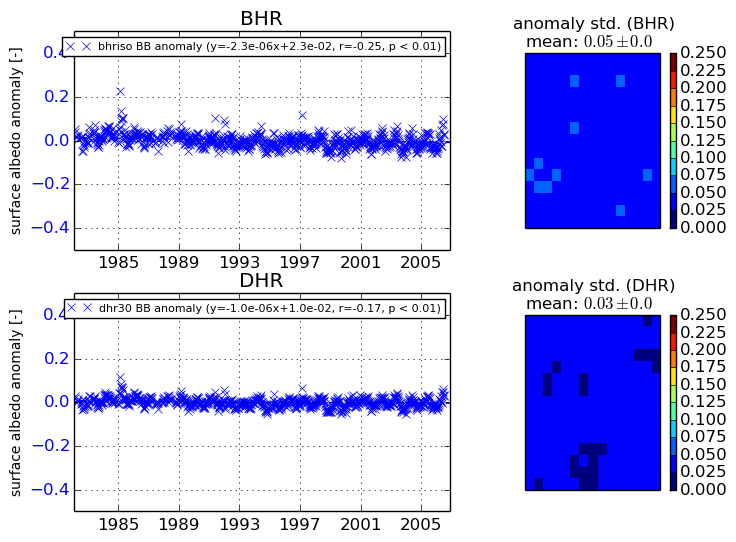
+000 deg


+057/+063 deg