BIG_MEADOWS


Location

lon / lat [deg]: -78.4361 / 38.5219

Source network: AERONET


Geostationary surface albedo (GSA) data


“+000”


“+057/+063”


Landcover information (based on ESA CCI landcover data)


Landcover fractions @ 2km distance


Landcover fractions @ 20 km distance


Legend


Distance to open water bodies [km]:

3.25

Distance to urban areas [km]:

0.45


Radius: 1 km

Number of landcover classes:

3

Dominant landcover type:

60: Tree cover, broadleaved, decidous

Fraction of dominant landcover type [%]:

93.0


Radius: 2 km

Number of landcover classes:

3

Dominant landcover type:

60: Tree cover, broadleaved, decidous

Fraction of dominant landcover type [%]:

86.0


Radius: 5 km

Number of landcover classes:

3

Dominant landcover type:

60: Tree cover, broadleaved, decidous

Fraction of dominant landcover type [%]:

78.0


Radius: 10 km

Number of landcover classes:

4

Dominant landcover type:

60: Tree cover, broadleaved, decidous

Fraction of dominant landcover type [%]:

76.0


Radius: 20 km

Number of landcover classes:

4

Dominant landcover type:

60: Tree cover, broadleaved, decidous

Fraction of dominant landcover type [%]:

53.0


Disturbances


Heterogeneity analysis

The heterogeneity analysis provides information about the spatial and temporal heterogeneity of the site.

Topography


Roman et al. (2009) index


St

5.5527522011

Rcv

0.437811844619

Rse

0.0

Rst

0.0861623166178

Rsv

0.0162984623833


Height range @ 1km [m]

115

Height range @ 2km [m]

321

Height range @ 5km [m]

653

Height range @ 10km [m]

-999

Height range @ 20km [m]

-999


Variance slope @ 1 km

9912

Variance slope @ 2 km

11167

Variance slope @ 5 km

12012

Variance slope @ 10 km

-999

Variance slope @ 20 km

-999


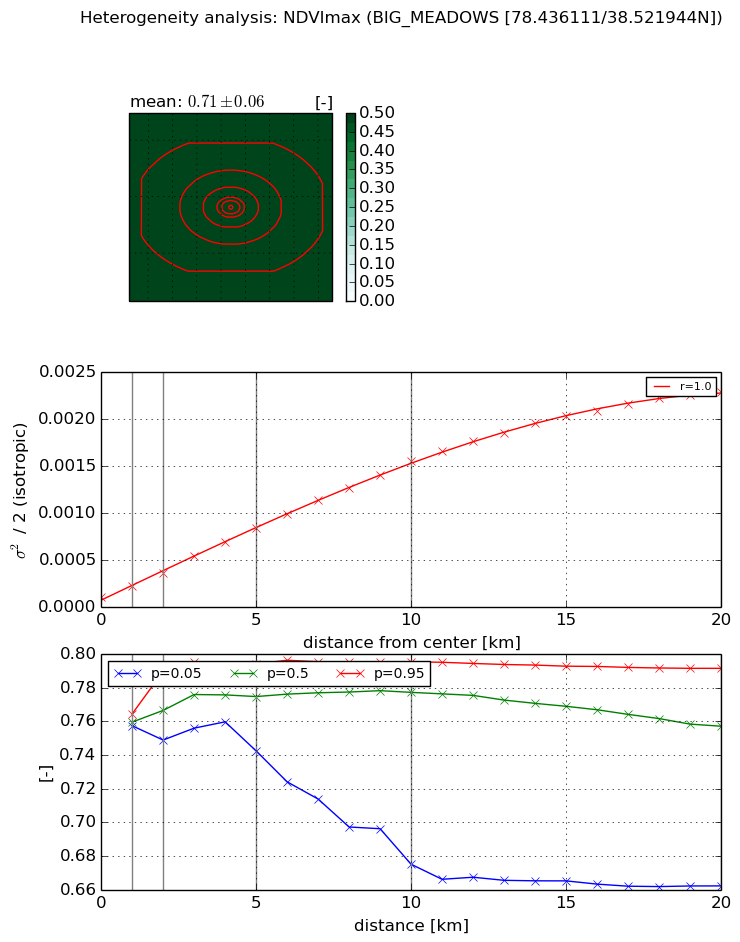
NDVI (max. NDVI composite)


Roman et al. (2009) index


St

1.87364010873

Rcv

0.203146494207

Rse

0.0

Rst

-0.398015629319

Rsv

-0.999999159276


NDVI range @ 1km [-]

0.01

NDVI range @ 2km [-]

0.04

NDVI range @ 5km [-]

0.05

NDVI range @ 10km [-]

0.12

NDVI range @ 20km [-]

0.13


Variance slope @ 1 km

0.000118683869099

Variance slope @ 2 km

0.000125717545802

Variance slope @ 5 km

0.000149758526102

Variance slope @ 10 km

0.00014691880021

Variance slope @ 20 km

0.000114082292651


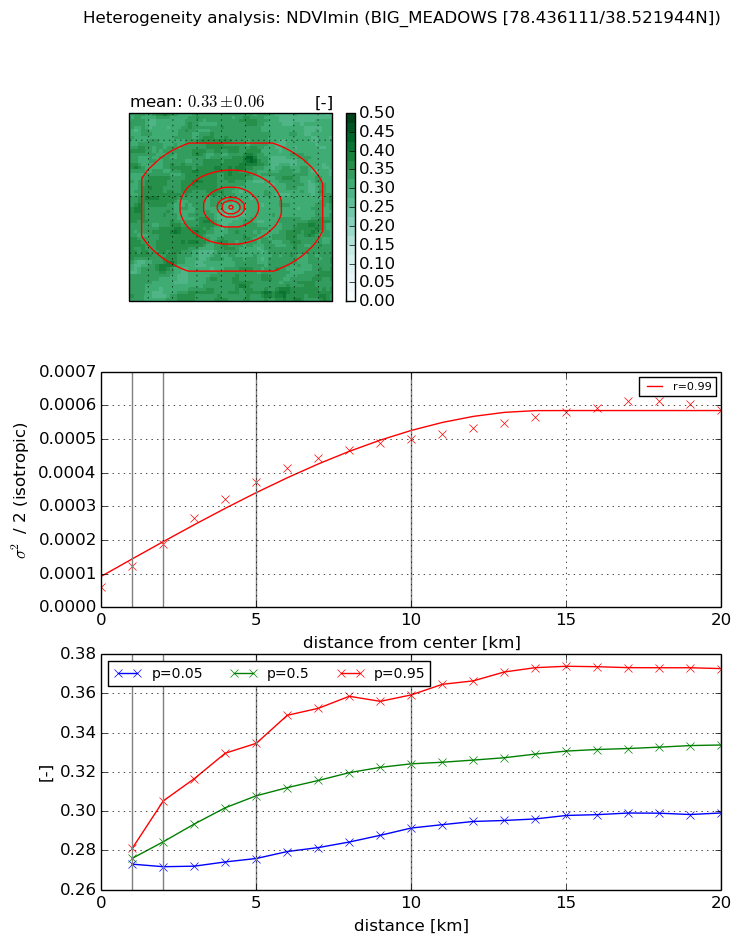
NDVI (min. NDVI composite)I


Roman et al. (2009) index


St

3.81329437685

Rcv

0.19576697269

Rse

0.0

Rst

-0.153961670981

Rsv

0.436992680078


NDVI range @ 1km [-]

0.01

NDVI range @ 2km [-]

0.03

NDVI range @ 5km [-]

0.06

NDVI range @ 10km [-]

0.07

NDVI range @ 20km [-]

0.07


NDVI slope @ 1 km

6.14126478494e-05

NDVI slope @ 2 km

6.35848246718e-05

NDVI slope @ 5 km

6.40210394275e-05

NDVI slope @ 10 km

4.50246987144e-05

NDVI slope @ 20 km

2.49168110175e-05


Temporal stability analysis

+000 deg (BHR)


BHR statistics

Temporal stability [1/decade]:


abs

rel


Weighted least square:

-99999.0


Ordinary least square:

-99999.0


Probabilities that GCOS criteria is met:

Weighted least square:

-99999.0 %

Ordinary least square:

-99999.0 %


DHR statistics

Temporal stability [1/decade]:


abs

rel


Weighted least square:

-99999.0


Ordinary least square:

-99999.0


Probabilities that GCOS criteria is met:

Weighted least square:

-99999.0 %

Ordinary least square:

-99999.0 %


+057/+063 deg (BHR)


BHR statistics

Temporal stability [1/decade]:


abs

rel


Weighted least square:

None


Ordinary least square:

None


Probabilities that GCOS criteria is met:

Weighted least square:

None %

Ordinary least square:

None %


DHR statistics

Temporal stability [1/decade]:


abs

rel


Weighted least square:

None


Ordinary least square:

None


Probabilities that GCOS criteria is met:

Weighted least square:

None %

Ordinary least square:

None %


Temporal anomaly analyis

The variance of the temporal anomalies provides an additional measure about the stability of the signal AFTER removal of the mean seasonal cylce.

+000 deg


+057/+063 deg