BILLERICA


Location

lon / lat [deg]: -71.2686 / 42.5283

Source network: AERONET


Geostationary surface albedo (GSA) data


“+000”


“+057/+063”


Landcover information (based on ESA CCI landcover data)


Landcover fractions @ 2km distance


Landcover fractions @ 20 km distance


Legend


Distance to open water bodies [km]:

0.71

Distance to urban areas [km]:

0.1


Radius: 1 km

Number of landcover classes:

3

Dominant landcover type:

190: urban areas

Fraction of dominant landcover type [%]:

89.0


Radius: 2 km

Number of landcover classes:

4

Dominant landcover type:

190: urban areas

Fraction of dominant landcover type [%]:

90.0


Radius: 5 km

Number of landcover classes:

6

Dominant landcover type:

190: urban areas

Fraction of dominant landcover type [%]:

81.0


Radius: 10 km

Number of landcover classes:

7

Dominant landcover type:

190: urban areas

Fraction of dominant landcover type [%]:

75.0


Radius: 20 km

Number of landcover classes:

7

Dominant landcover type:

190: urban areas

Fraction of dominant landcover type [%]:

73.0


Disturbances


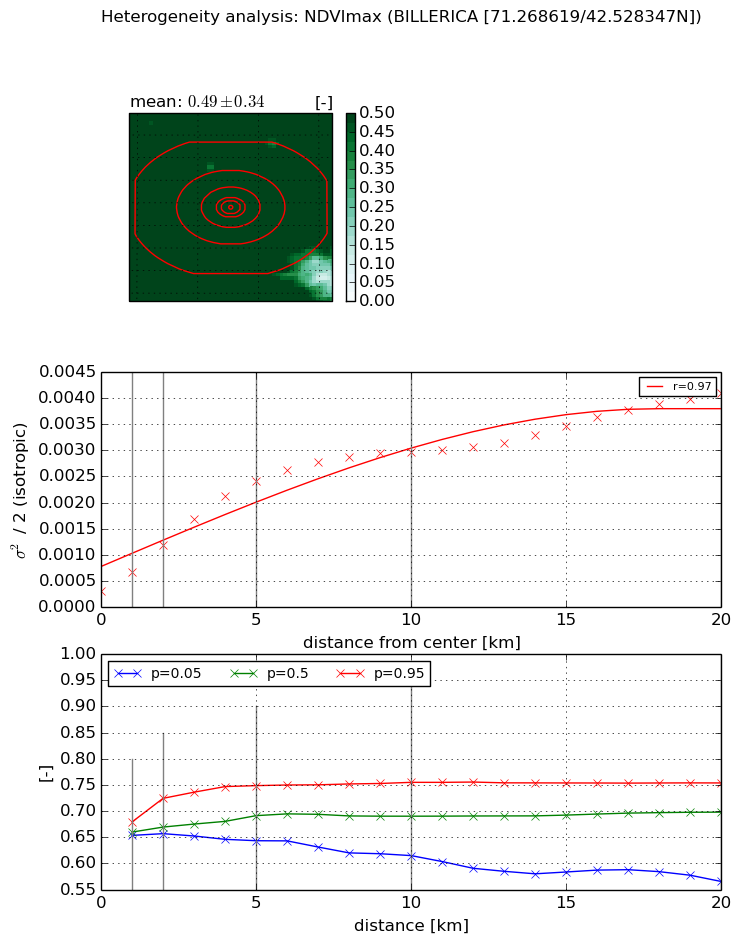
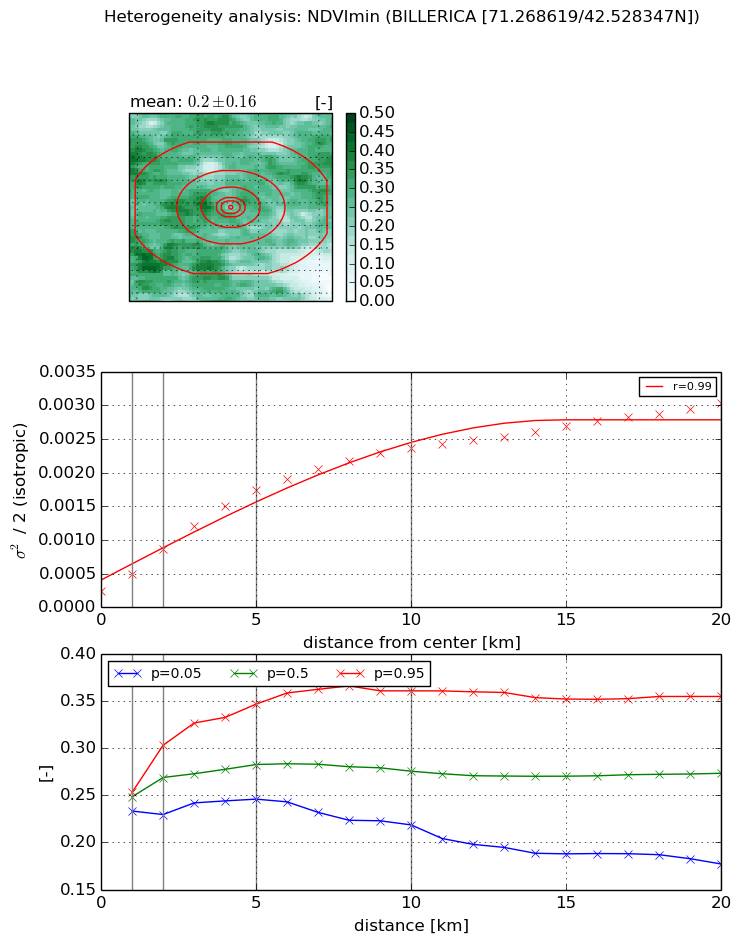
Heterogeneity analysis

The heterogeneity analysis provides information about the spatial and temporal heterogeneity of the site.

Topography


Roman et al. (2009) index


St

12.0718604591

Rcv

0.114209500743

Rse

0.0

Rst

-0.0511968241797

Rsv

0.0831054939608


Height range @ 1km [m]

26

Height range @ 2km [m]

30

Height range @ 5km [m]

42

Height range @ 10km [m]

-999

Height range @ 20km [m]

-999


Variance slope @ 1 km

96

Variance slope @ 2 km

71

Variance slope @ 5 km

29

Variance slope @ 10 km

-999

Variance slope @ 20 km

-999


NDVI (max. NDVI composite)


Roman et al. (2009) index


St

6.63377102751

Rcv

0.213162288707

Rse

0.0

Rst

-0.077849702239

Rsv

0.161219475524


NDVI range @ 1km [-]

0.03

NDVI range @ 2km [-]

0.07

NDVI range @ 5km [-]

0.11

NDVI range @ 10km [-]

0.14

NDVI range @ 20km [-]

0.19


Variance slope @ 1 km

0.000357445813074

Variance slope @ 2 km

0.000441652381841

Variance slope @ 5 km

0.000439484828802

Variance slope @ 10 km

0.000273509558545

Variance slope @ 20 km

0.000158754660131


NDVI (min. NDVI composite)I


Roman et al. (2009) index


St

5.25922151468

Rcv

0.0422682958721

Rse

0.0

Rst

-0.109861267208

Rsv

0.418297065961


NDVI range @ 1km [-]

0.02

NDVI range @ 2km [-]

0.07

NDVI range @ 5km [-]

0.1

NDVI range @ 10km [-]

0.14

NDVI range @ 20km [-]

0.18


NDVI slope @ 1 km

0.000258636757871

NDVI slope @ 2 km

0.000317256458294

NDVI slope @ 5 km

0.000311139955627

NDVI slope @ 10 km

0.00021685845579

NDVI slope @ 20 km

0.000122974586914


Temporal stability analysis

+000 deg (BHR)


BHR statistics

Temporal stability [1/decade]:


abs

rel


Weighted least square:

-99999.0


Ordinary least square:

-99999.0


Probabilities that GCOS criteria is met:

Weighted least square:

-99999.0 %

Ordinary least square:

-99999.0 %


DHR statistics

Temporal stability [1/decade]:


abs

rel


Weighted least square:

-99999.0


Ordinary least square:

-99999.0


Probabilities that GCOS criteria is met:

Weighted least square:

-99999.0 %

Ordinary least square:

-99999.0 %


+057/+063 deg (BHR)


BHR statistics

Temporal stability [1/decade]:


abs

rel


Weighted least square:

None


Ordinary least square:

None


Probabilities that GCOS criteria is met:

Weighted least square:

None %

Ordinary least square:

None %


DHR statistics

Temporal stability [1/decade]:


abs

rel


Weighted least square:

None


Ordinary least square:

None


Probabilities that GCOS criteria is met:

Weighted least square:

None %

Ordinary least square:

None %


Temporal anomaly analyis

The variance of the temporal anomalies provides an additional measure about the stability of the signal AFTER removal of the mean seasonal cylce.

+000 deg


+057/+063 deg