BODELE


Location

lon / lat [deg]: 18.55 / 16.883

Source network: AERONET


Geostationary surface albedo (GSA) data


“+000”


“+057/+063”


Landcover information (based on ESA CCI landcover data)


Landcover fractions @ 2km distance


Landcover fractions @ 20 km distance


Legend


Distance to open water bodies [km]:

4.81

Distance to urban areas [km]:

none in region


Radius: 1 km

Number of landcover classes:

1

Dominant landcover type:

200: bare areas

Fraction of dominant landcover type [%]:

100.0


Radius: 2 km

Number of landcover classes:

1

Dominant landcover type:

200: bare areas

Fraction of dominant landcover type [%]:

100.0


Radius: 5 km

Number of landcover classes:

1

Dominant landcover type:

200: bare areas

Fraction of dominant landcover type [%]:

99.0


Radius: 10 km

Number of landcover classes:

1

Dominant landcover type:

200: bare areas

Fraction of dominant landcover type [%]:

99.0


Radius: 20 km

Number of landcover classes:

2

Dominant landcover type:

200: bare areas

Fraction of dominant landcover type [%]:

99.0


Disturbances


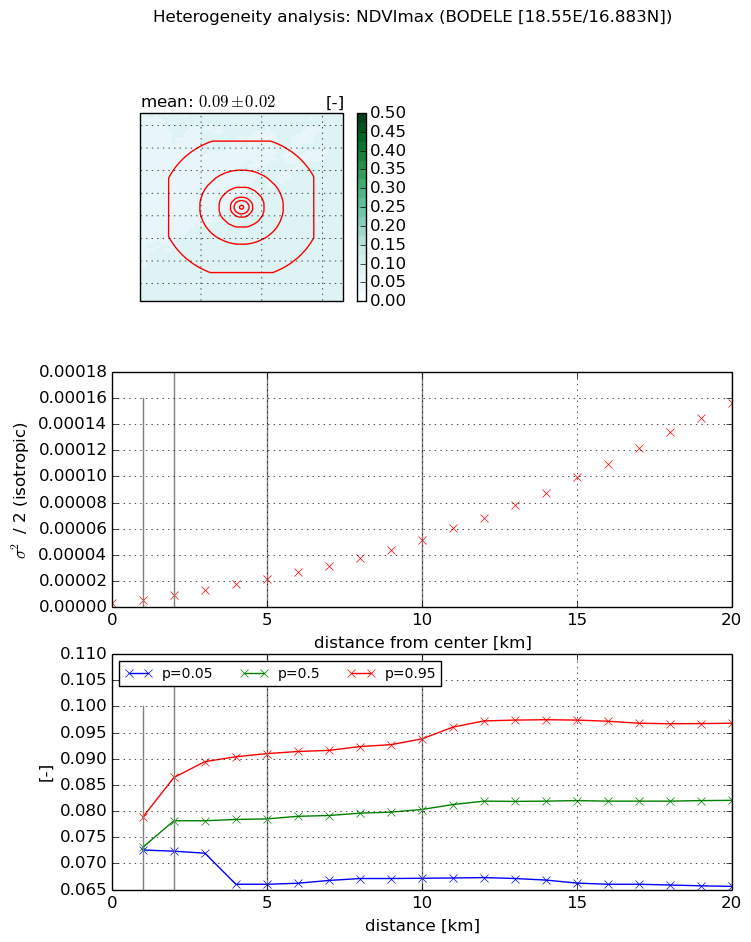
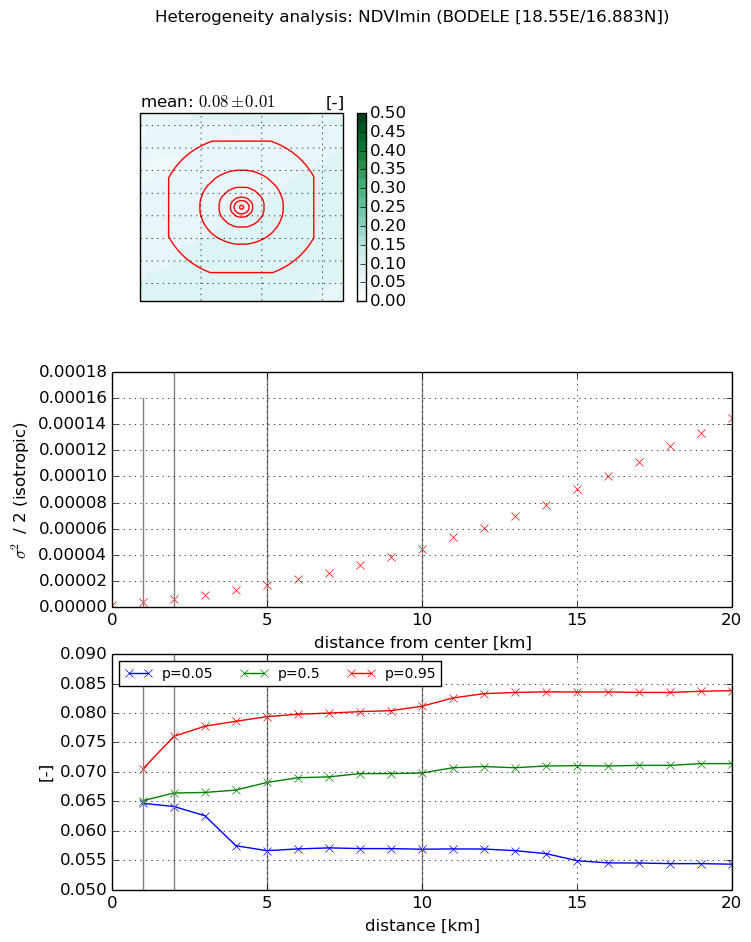
Heterogeneity analysis

The heterogeneity analysis provides information about the spatial and temporal heterogeneity of the site.

Topography


Roman et al. (2009) index


St

3.05937430633

Rcv

0.647804498224

Rse

0.0

Rst

-1.64617652504e-05

Rsv

-0.332771703612


Height range @ 1km [m]

9

Height range @ 2km [m]

14

Height range @ 5km [m]

34

Height range @ 10km [m]

-999

Height range @ 20km [m]

-999


Variance slope @ 1 km

8

Variance slope @ 2 km

10

Variance slope @ 5 km

20

Variance slope @ 10 km

-999

Variance slope @ 20 km

-999


NDVI (max. NDVI composite)


Roman et al. (2009) index


St

0.0262348996175

Rcv

0.405884100706

Rse

0.0

Rst

6.24347602143e-07

Rsv

113.945610563


NDVI range @ 1km [-]

0.01

NDVI range @ 2km [-]

0.01

NDVI range @ 5km [-]

0.02

NDVI range @ 10km [-]

0.03

NDVI range @ 20km [-]

0.03


Variance slope @ 1 km

2.55396442122e-06

Variance slope @ 2 km

3.27217870391e-06

Variance slope @ 5 km

3.81144478481e-06

Variance slope @ 10 km

4.73555663568e-06

Variance slope @ 20 km

7.71064662171e-06


NDVI (min. NDVI composite)I


Roman et al. (2009) index


St

2.87040443581

Rcv

0.4174035121

Rse

0.0

Rst

-8.32192612599e-08

Rsv

-0.627745291219


NDVI range @ 1km [-]

0.01

NDVI range @ 2km [-]

0.01

NDVI range @ 5km [-]

0.02

NDVI range @ 10km [-]

0.02

NDVI range @ 20km [-]

0.03


NDVI slope @ 1 km

1.69880273382e-06

NDVI slope @ 2 km

2.30989858615e-06

NDVI slope @ 5 km

3.10548694684e-06

NDVI slope @ 10 km

4.26488236126e-06

NDVI slope @ 20 km

7.2196070962e-06


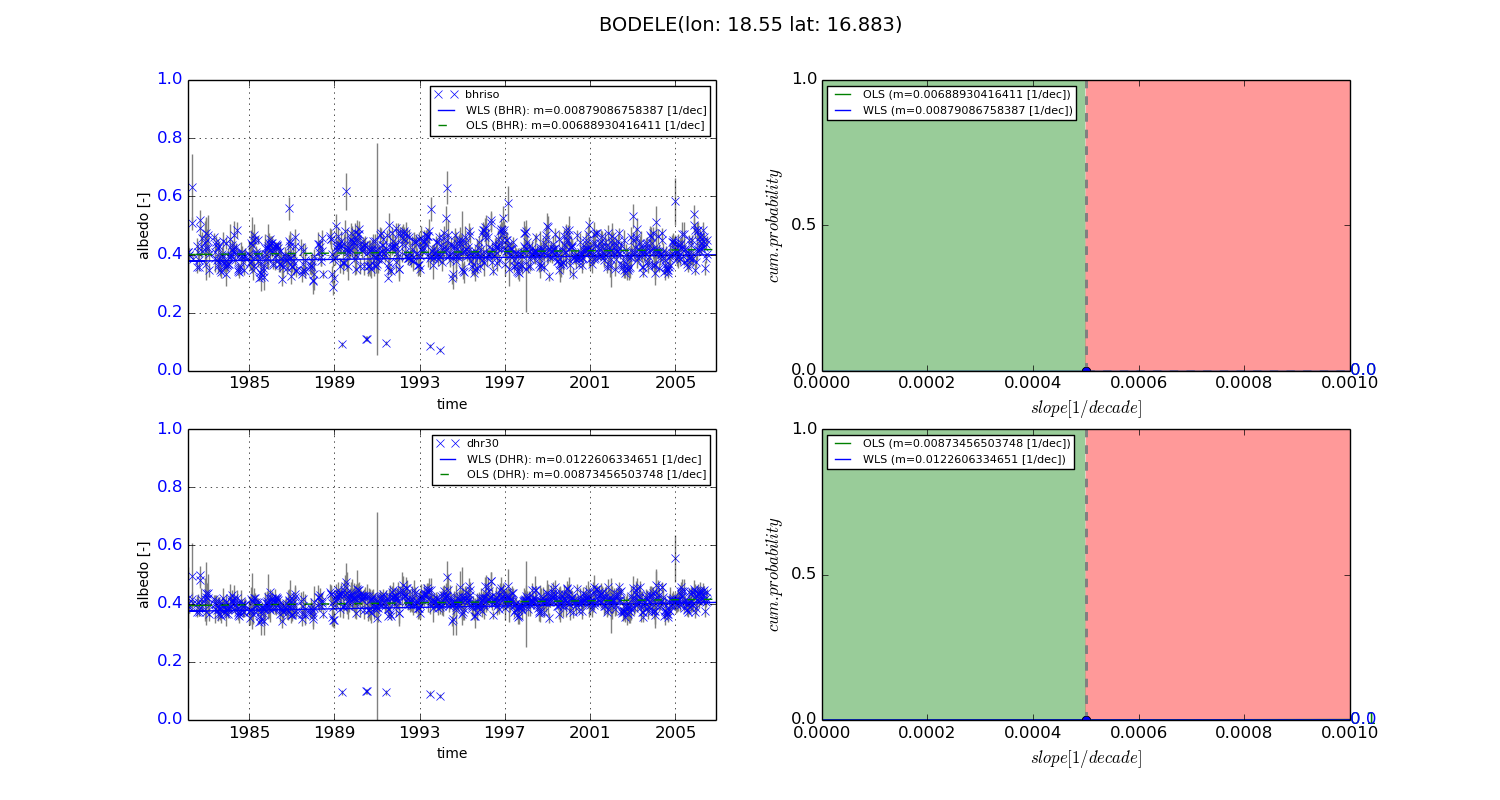
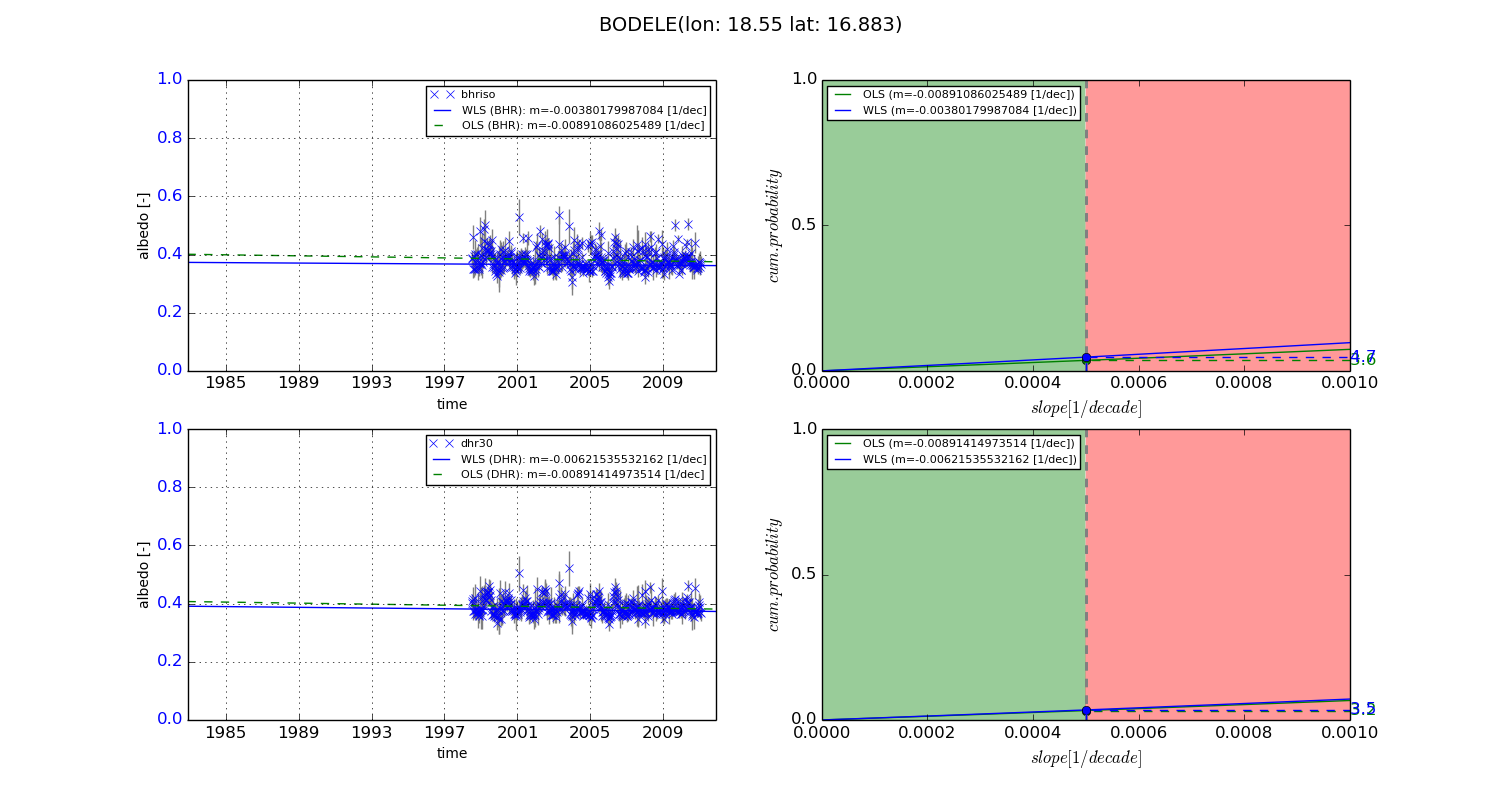
Temporal stability analysis

+000 deg (BHR)


BHR statistics

Temporal stability [1/decade]:


abs

rel


Weighted least square:

0.00879086758387


Ordinary least square:

0.00688930416411


Probabilities that GCOS criteria is met:

Weighted least square:

0.0 %

Ordinary least square:

0.0 %


DHR statistics

Temporal stability [1/decade]:


abs

rel


Weighted least square:

0.0122606334651


Ordinary least square:

0.00873456503748


Probabilities that GCOS criteria is met:

Weighted least square:

0.0 %

Ordinary least square:

0.1 %


+057/+063 deg (BHR)


BHR statistics

Temporal stability [1/decade]:


abs

rel


Weighted least square:

-0.00380179987084


Ordinary least square:

-0.00891086025489


Probabilities that GCOS criteria is met:

Weighted least square:

4.7 %

Ordinary least square:

3.6 %


DHR statistics

Temporal stability [1/decade]:


abs

rel


Weighted least square:

-0.00621535532162


Ordinary least square:

-0.00891414973514


Probabilities that GCOS criteria is met:

Weighted least square:

3.5 %

Ordinary least square:

3.2 %


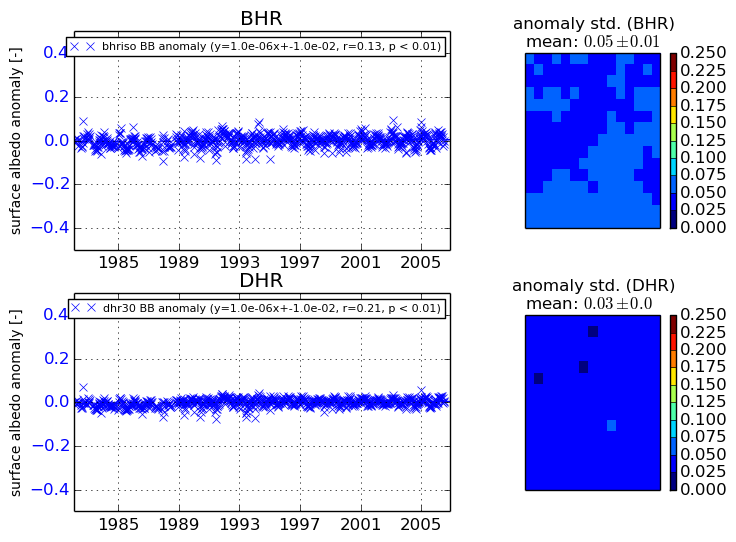
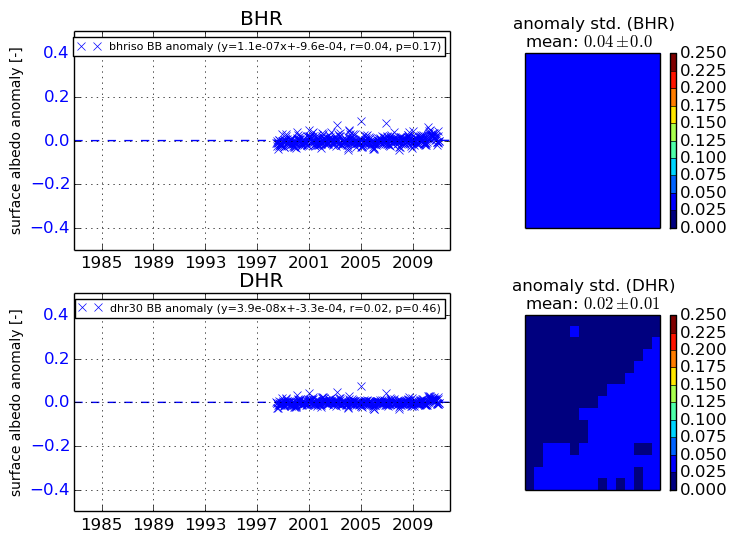
Temporal anomaly analyis

The variance of the temporal anomalies provides an additional measure about the stability of the signal AFTER removal of the mean seasonal cylce.
+000 deg


+057/+063 deg