BONANZA_CREEK_LTER_BNZ


Location

lon / lat [deg]: -147.85 / 64.86

Source network: LTER


Geostationary surface albedo (GSA) data


“+000”


“+057/+063”


Landcover information (based on ESA CCI landcover data)


Landcover fractions @ 2km distance


Landcover fractions @ 20 km distance


Legend


Distance to open water bodies [km]:

3.91

Distance to urban areas [km]:

1.68


Radius: 1 km

Number of landcover classes:

3

Dominant landcover type:

150: Sparse vegetation (tree, shrub, herbaceous cover) (<15%)

Fraction of dominant landcover type [%]:

72.0


Radius: 2 km

Number of landcover classes:

6

Dominant landcover type:

150: Sparse vegetation (tree, shrub, herbaceous cover) (<15%)

Fraction of dominant landcover type [%]:

40.0


Radius: 5 km

Number of landcover classes:

8

Dominant landcover type:

70: Tree cover, needleleaved, evergreen, closed to open (>15%)

Fraction of dominant landcover type [%]:

33.0


Radius: 10 km

Number of landcover classes:

9

Dominant landcover type:

70: Tree cover, needleleaved, evergreen, closed to open (>15%)

Fraction of dominant landcover type [%]:

28.0


Radius: 20 km

Number of landcover classes:

8

Dominant landcover type:

70: Tree cover, needleleaved, evergreen, closed to open (>15%)

Fraction of dominant landcover type [%]:

41.0


Disturbances


Heterogeneity analysis

The heterogeneity analysis provides information about the spatial and temporal heterogeneity of the site.

Topography


Roman et al. (2009) index


St

0.000317109334973

Rcv

0.436271777223

Rse

0.0

Rst

-0.0417577034468

Rsv

9459.98140561


Height range @ 1km [m]

35

Height range @ 2km [m]

45

Height range @ 5km [m]

89

Height range @ 10km [m]

-999

Height range @ 20km [m]

-999


Variance slope @ 1 km

376

Variance slope @ 2 km

328

Variance slope @ 5 km

211

Variance slope @ 10 km

-999

Variance slope @ 20 km

-999


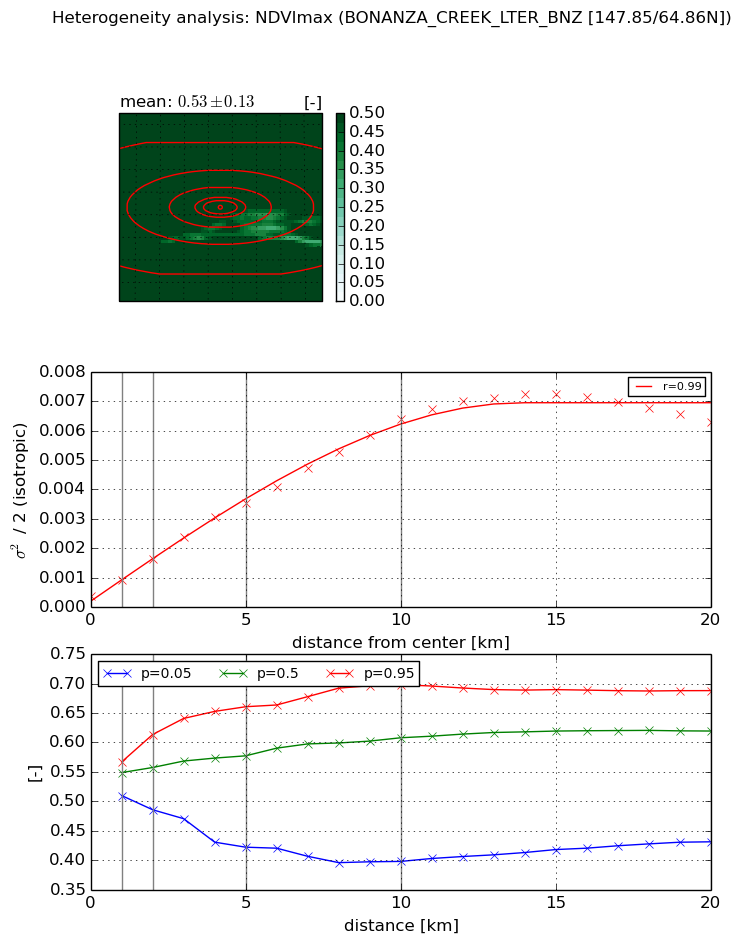
NDVI (max. NDVI composite)


Roman et al. (2009) index


St

1.97236954468

Rcv

0.386793675115

Rse

0.0

Rst

-0.134219565135

Rsv

-0.999999902592


NDVI range @ 1km [-]

0.06

NDVI range @ 2km [-]

0.13

NDVI range @ 5km [-]

0.24

NDVI range @ 10km [-]

0.3

NDVI range @ 20km [-]

0.26


Variance slope @ 1 km

0.000543045409317

Variance slope @ 2 km

0.000629161618155

Variance slope @ 5 km

0.000660865624521

Variance slope @ 10 km

0.000604723472956

Variance slope @ 20 km

0.000325234990077


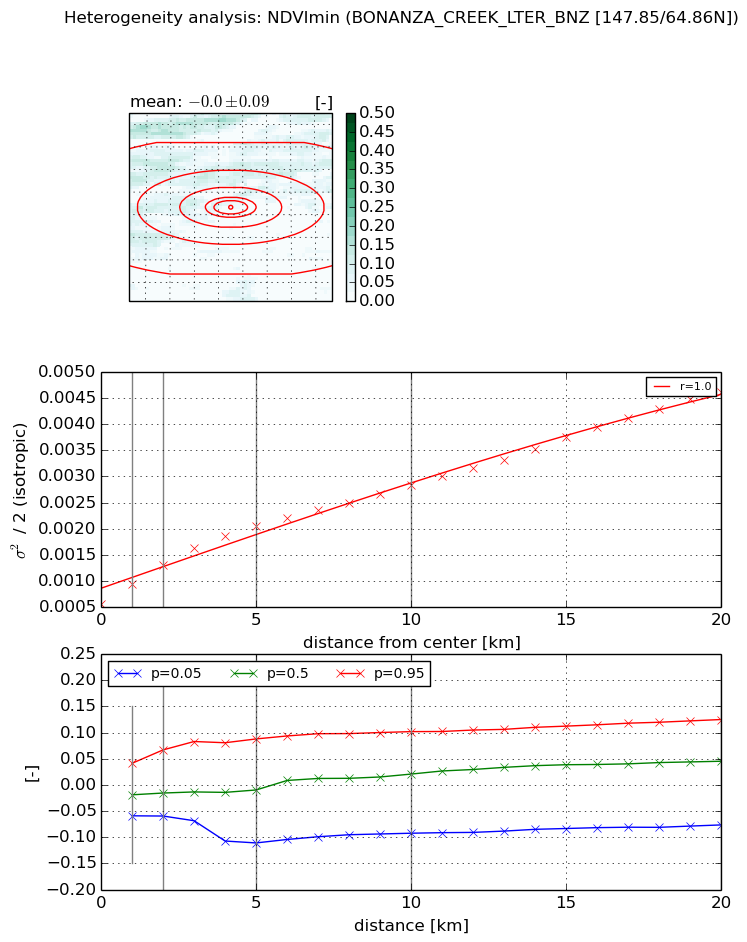
NDVI (min. NDVI composite)I


Roman et al. (2009) index


St

0.0060853379905

Rcv

491.827645059

Rse

0.0

Rst

-0.160584401864

Rsv

-0.999999736106


NDVI range @ 1km [-]

0.1

NDVI range @ 2km [-]

0.13

NDVI range @ 5km [-]

0.2

NDVI range @ 10km [-]

0.19

NDVI range @ 20km [-]

0.2


NDVI slope @ 1 km

0.000387175085841

NDVI slope @ 2 km

0.000374847090146

NDVI slope @ 5 km

0.000301350108605

NDVI slope @ 10 km

0.000214156819828

NDVI slope @ 20 km

0.000187226918162


Temporal stability analysis

+000 deg (BHR)


BHR statistics

Temporal stability [1/decade]:


abs

rel


Weighted least square:

None


Ordinary least square:

None


Probabilities that GCOS criteria is met:

Weighted least square:

None %

Ordinary least square:

None %


DHR statistics

Temporal stability [1/decade]:


abs

rel


Weighted least square:

None


Ordinary least square:

None


Probabilities that GCOS criteria is met:

Weighted least square:

None %

Ordinary least square:

None %


+057/+063 deg (BHR)


BHR statistics

Temporal stability [1/decade]:


abs

rel


Weighted least square:

None


Ordinary least square:

None


Probabilities that GCOS criteria is met:

Weighted least square:

None %

Ordinary least square:

None %


DHR statistics

Temporal stability [1/decade]:


abs

rel


Weighted least square:

None


Ordinary least square:

None


Probabilities that GCOS criteria is met:

Weighted least square:

None %

Ordinary least square:

None %


Temporal anomaly analyis

The variance of the temporal anomalies provides an additional measure about the stability of the signal AFTER removal of the mean seasonal cylce.

+000 deg


+057/+063 deg


By continuing to use this website, you are giving consent to analytic cookies being used. For more information on how EUMETSAT uses data and how you can disable this, please view this web page: Analytics Cookie Policy