BONDOUKOUI


Location

lon / lat [deg]: -3.75 / 11.85

Source network: AERONET


Geostationary surface albedo (GSA) data


“+000”


“+057/+063”


Landcover information (based on ESA CCI landcover data)


Landcover fractions @ 2km distance


Landcover fractions @ 20 km distance


Legend


Distance to open water bodies [km]:

24.66

Distance to urban areas [km]:

0.65


Radius: 1 km

Number of landcover classes:

4

Dominant landcover type:

10: cropland, rainfed

Fraction of dominant landcover type [%]:

81.0


Radius: 2 km

Number of landcover classes:

4

Dominant landcover type:

10: cropland, rainfed

Fraction of dominant landcover type [%]:

75.0


Radius: 5 km

Number of landcover classes:

3

Dominant landcover type:

10: cropland, rainfed

Fraction of dominant landcover type [%]:

88.0


Radius: 10 km

Number of landcover classes:

4

Dominant landcover type:

10: cropland, rainfed

Fraction of dominant landcover type [%]:

86.0


Radius: 20 km

Number of landcover classes:

4

Dominant landcover type:

10: cropland, rainfed

Fraction of dominant landcover type [%]:

78.0


Disturbances


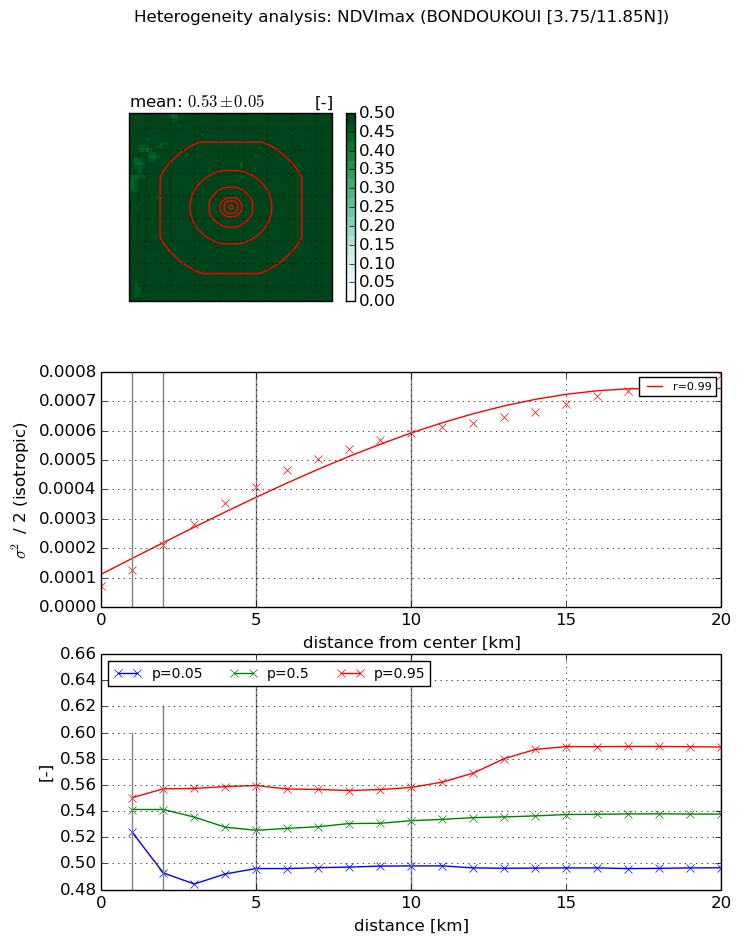
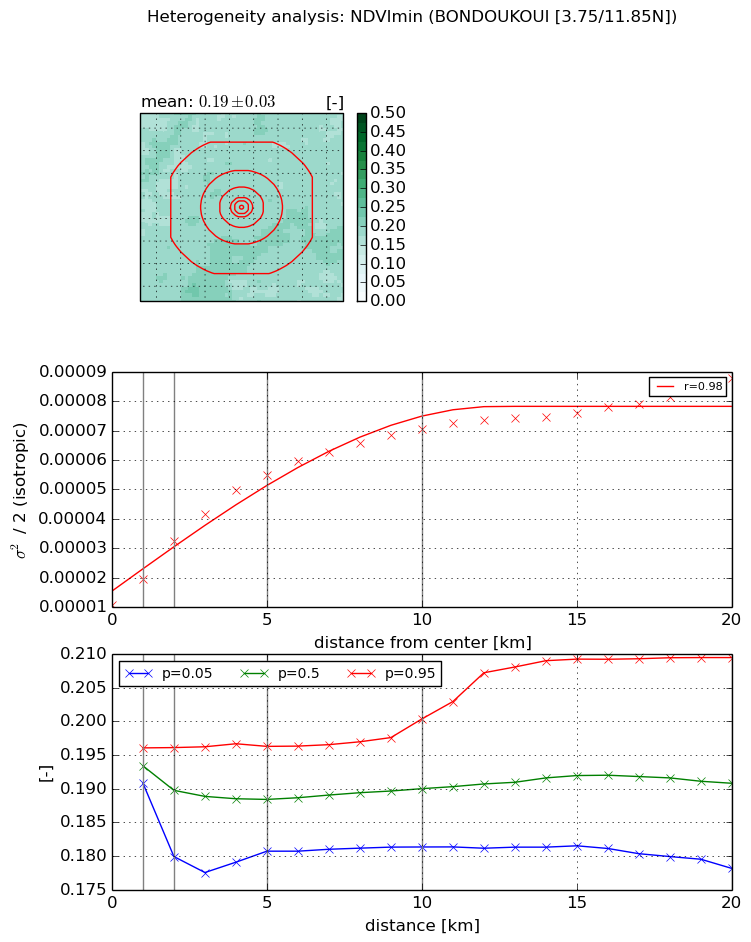
Heterogeneity analysis

The heterogeneity analysis provides information about the spatial and temporal heterogeneity of the site.

Topography


Roman et al. (2009) index


St

6.19196072351

Rcv

0.365827958617

Rse

0.0

Rst

-8.10317677116e-07

Rsv

0.118670428324


Height range @ 1km [m]

28

Height range @ 2km [m]

38

Height range @ 5km [m]

76

Height range @ 10km [m]

-999

Height range @ 20km [m]

-999


Variance slope @ 1 km

69

Variance slope @ 2 km

85

Variance slope @ 5 km

117

Variance slope @ 10 km

-999

Variance slope @ 20 km

-999


NDVI (max. NDVI composite)


Roman et al. (2009) index


St

11.2119943909

Rcv

-0.158957260344

Rse

0.0

Rst

0.00360853561974

Rsv

-0.105004798117


NDVI range @ 1km [-]

0.03

NDVI range @ 2km [-]

0.06

NDVI range @ 5km [-]

0.06

NDVI range @ 10km [-]

0.06

NDVI range @ 20km [-]

0.09


Variance slope @ 1 km

5.44368745278e-05

Variance slope @ 2 km

7.02372844123e-05

Variance slope @ 5 km

6.98784153186e-05

Variance slope @ 10 km

5.37645394585e-05

Variance slope @ 20 km

3.31354352181e-05


NDVI (min. NDVI composite)I


Roman et al. (2009) index


St

4.73784906566

Rcv

-0.0962826219878

Rse

0.0

Rst

0.232583910358

Rsv

-0.304332195268


NDVI range @ 1km [-]

0.01

NDVI range @ 2km [-]

0.02

NDVI range @ 5km [-]

0.02

NDVI range @ 10km [-]

0.02

NDVI range @ 20km [-]

0.03


NDVI slope @ 1 km

8.70776485128e-06

NDVI slope @ 2 km

1.07917147269e-05

NDVI slope @ 5 km

9.17173932516e-06

NDVI slope @ 10 km

5.88560566519e-06

NDVI slope @ 20 km

3.12532381584e-06


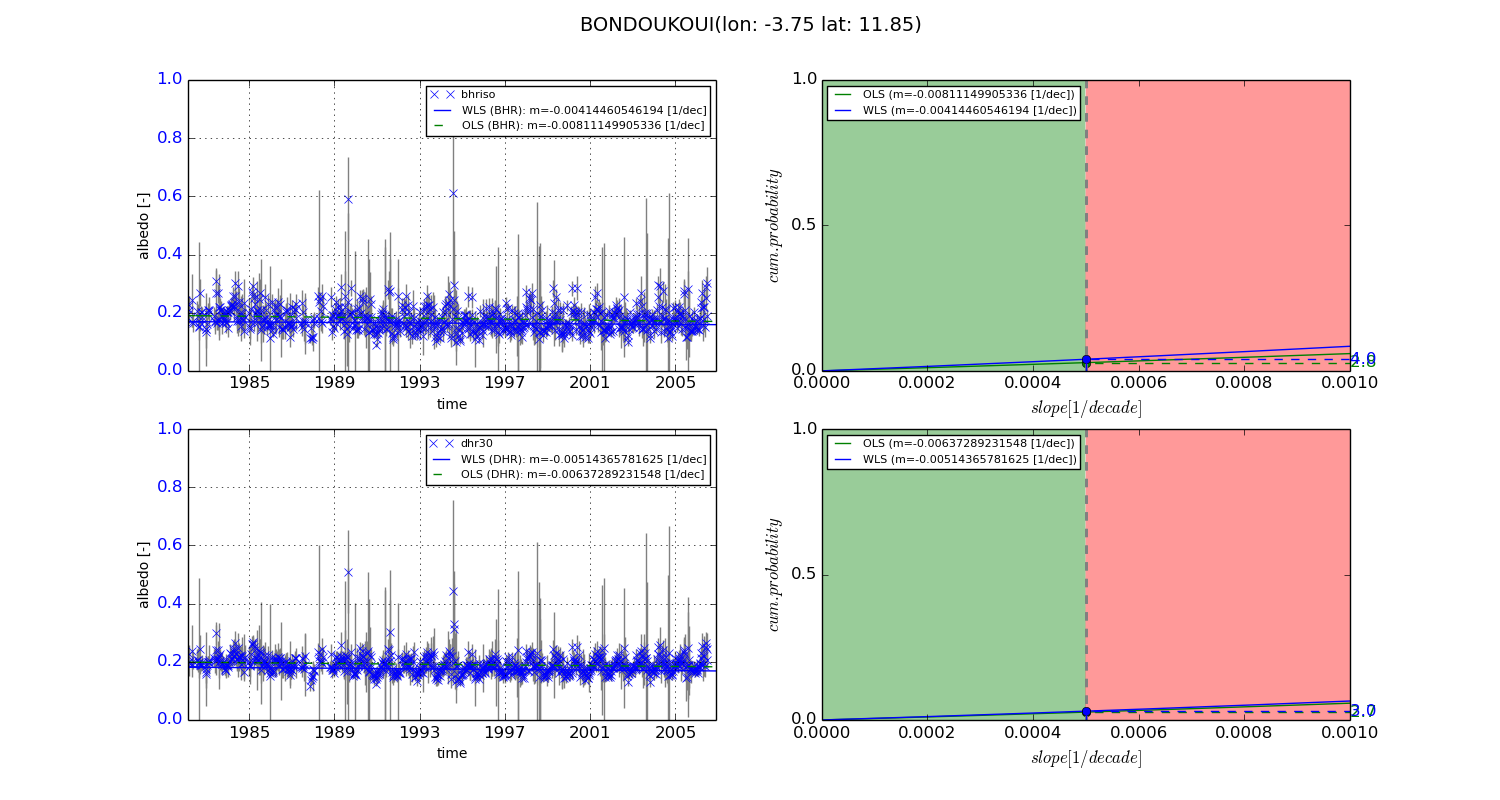
Temporal stability analysis

+000 deg (BHR)


BHR statistics

Temporal stability [1/decade]:


abs

rel


Weighted least square:

-0.00414460546194


Ordinary least square:

-0.00811149905336


Probabilities that GCOS criteria is met:

Weighted least square:

4.0 %

Ordinary least square:

2.8 %


DHR statistics

Temporal stability [1/decade]:


abs

rel


Weighted least square:

-0.00514365781625


Ordinary least square:

-0.00637289231548


Probabilities that GCOS criteria is met:

Weighted least square:

3.0 %

Ordinary least square:

2.7 %


+057/+063 deg (BHR)


BHR statistics

Temporal stability [1/decade]:


abs

rel


Weighted least square:

-99999.0


Ordinary least square:

-99999.0


Probabilities that GCOS criteria is met:

Weighted least square:

-99999.0 %

Ordinary least square:

-99999.0 %


DHR statistics

Temporal stability [1/decade]:


abs

rel


Weighted least square:

-99999.0


Ordinary least square:

-99999.0


Probabilities that GCOS criteria is met:

Weighted least square:

-99999.0 %

Ordinary least square:

-99999.0 %


Temporal anomaly analyis

The variance of the temporal anomalies provides an additional measure about the stability of the signal AFTER removal of the mean seasonal cylce.
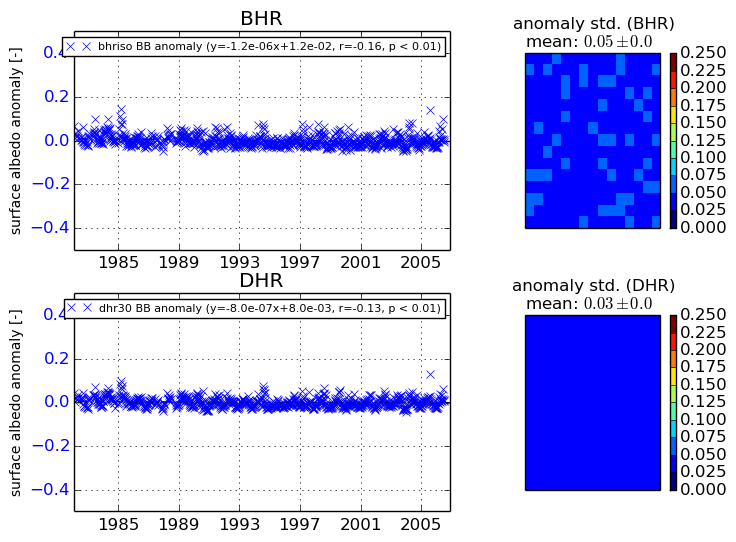
+000 deg


+057/+063 deg