BORDJ_BADJI_MOKHTAR


Location

lon / lat [deg]: 0.95 / 21.33

Source network: AERONET


Geostationary surface albedo (GSA) data


“+000”


“+057/+063”


Landcover information (based on ESA CCI landcover data)


Landcover fractions @ 2km distance


Landcover fractions @ 20 km distance


Legend


Distance to open water bodies [km]:

none in region

Distance to urban areas [km]:

0.26


Radius: 1 km

Number of landcover classes:

2

Dominant landcover type:

190: urban areas

Fraction of dominant landcover type [%]:

56.0


Radius: 2 km

Number of landcover classes:

2

Dominant landcover type:

200: bare areas

Fraction of dominant landcover type [%]:

87.0


Radius: 5 km

Number of landcover classes:

2

Dominant landcover type:

200: bare areas

Fraction of dominant landcover type [%]:

98.0


Radius: 10 km

Number of landcover classes:

2

Dominant landcover type:

200: bare areas

Fraction of dominant landcover type [%]:

99.0


Radius: 20 km

Number of landcover classes:

1

Dominant landcover type:

200: bare areas

Fraction of dominant landcover type [%]:

100.0


Disturbances


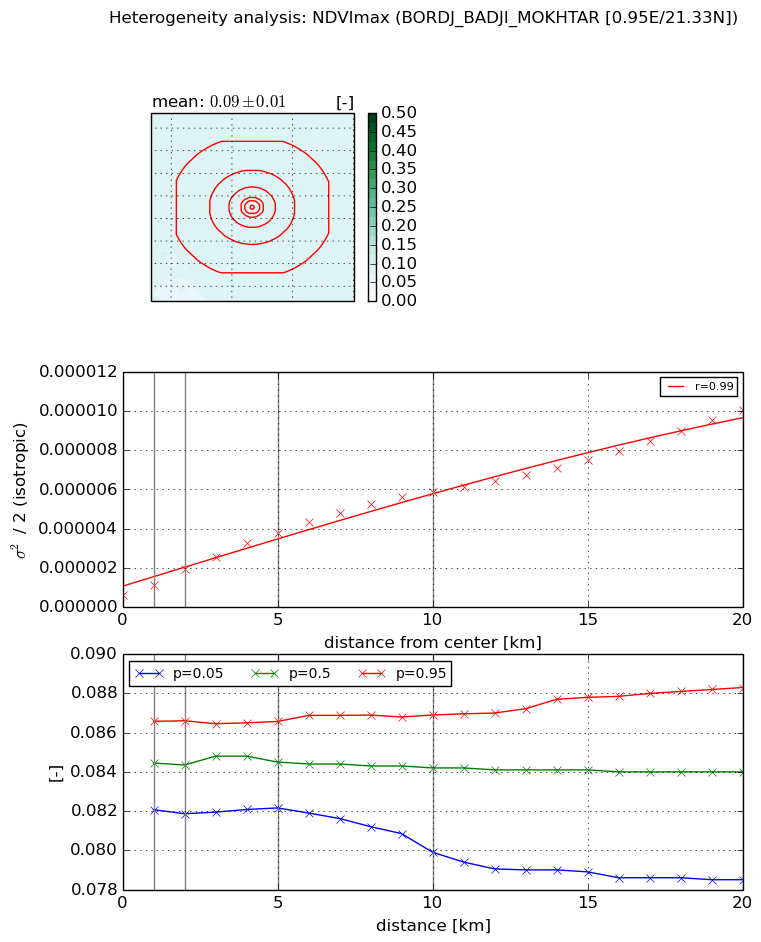
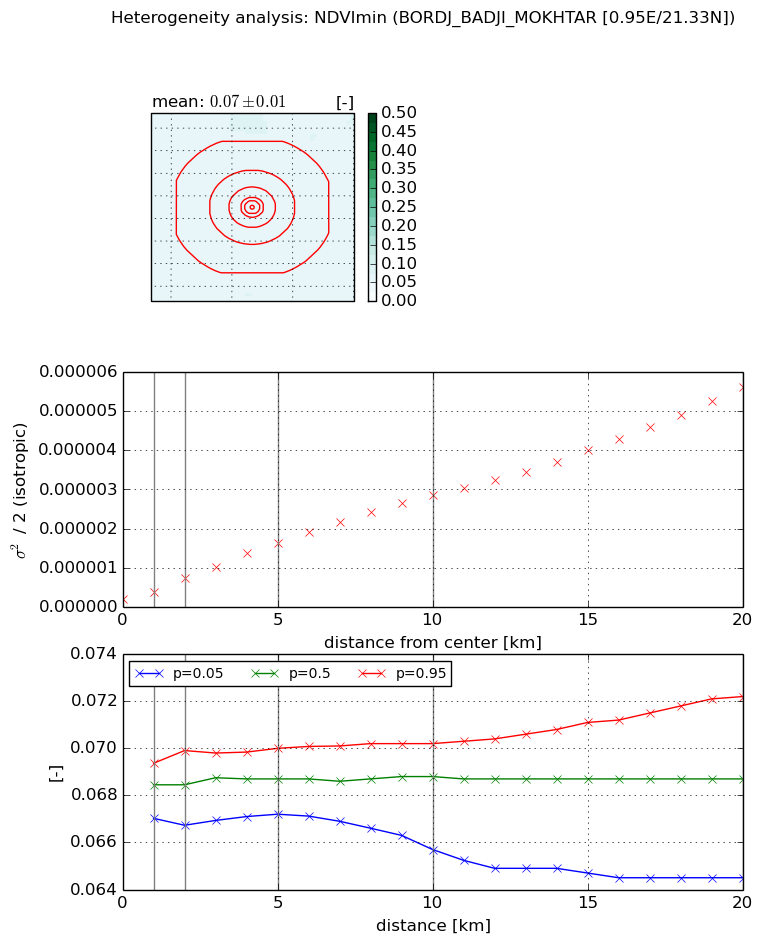
Heterogeneity analysis

The heterogeneity analysis provides information about the spatial and temporal heterogeneity of the site.

Topography


Roman et al. (2009) index


St

13.1797266079

Rcv

-0.00632183532416

Rse

0.0

Rst

-0.0348427450514

Rsv

-0.186457743611


Height range @ 1km [m]

11

Height range @ 2km [m]

16

Height range @ 5km [m]

18

Height range @ 10km [m]

-999

Height range @ 20km [m]

-999


Variance slope @ 1 km

11

Variance slope @ 2 km

11

Variance slope @ 5 km

6

Variance slope @ 10 km

-999

Variance slope @ 20 km

-999


NDVI (max. NDVI composite)


Roman et al. (2009) index


St

4.01502128308

Rcv

-0.0508000248065

Rse

0.0

Rst

-0.0684075599867

Rsv

0.627986461883


NDVI range @ 1km [-]

0.0

NDVI range @ 2km [-]

0.0

NDVI range @ 5km [-]

0.0

NDVI range @ 10km [-]

0.01

NDVI range @ 20km [-]

0.01


Variance slope @ 1 km

5.02471419886e-07

Variance slope @ 2 km

6.69126129097e-07

Variance slope @ 5 km

6.46014484988e-07

Variance slope @ 10 km

5.41375553301e-07

Variance slope @ 20 km

4.34292494826e-07


NDVI (min. NDVI composite)I


Roman et al. (2009) index


St

4.23647339399

Rcv

-0.101823038

Rse

0.0

Rst

-0.276869052833

Rsv

0.329444068893


NDVI range @ 1km [-]

0.0

NDVI range @ 2km [-]

0.0

NDVI range @ 5km [-]

0.0

NDVI range @ 10km [-]

0.0

NDVI range @ 20km [-]

0.01


NDVI slope @ 1 km

1.84744829651e-07

NDVI slope @ 2 km

2.63364335795e-07

NDVI slope @ 5 km

2.95560040238e-07

NDVI slope @ 10 km

2.74692074171e-07

NDVI slope @ 20 km

2.57474125474e-07


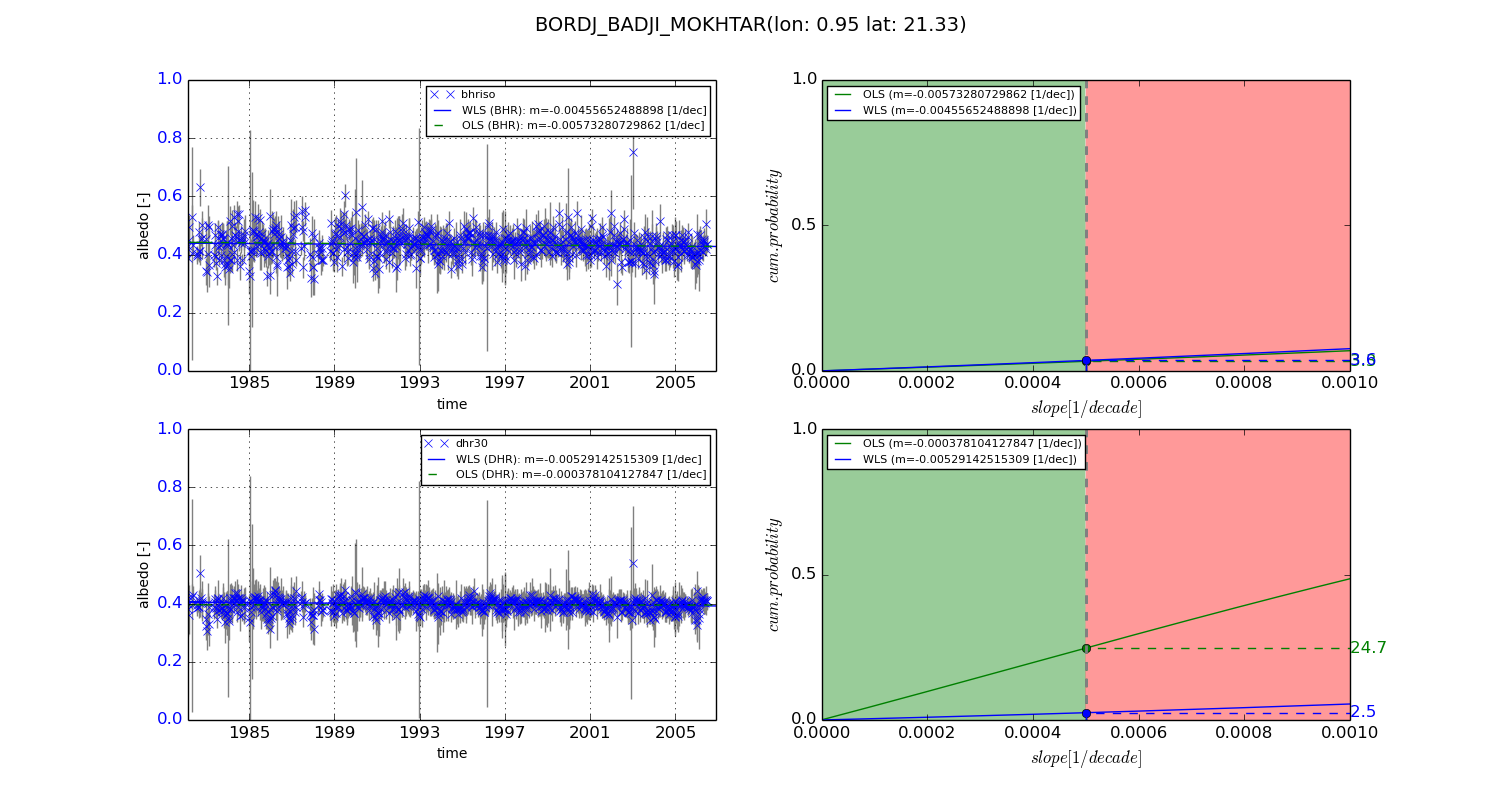
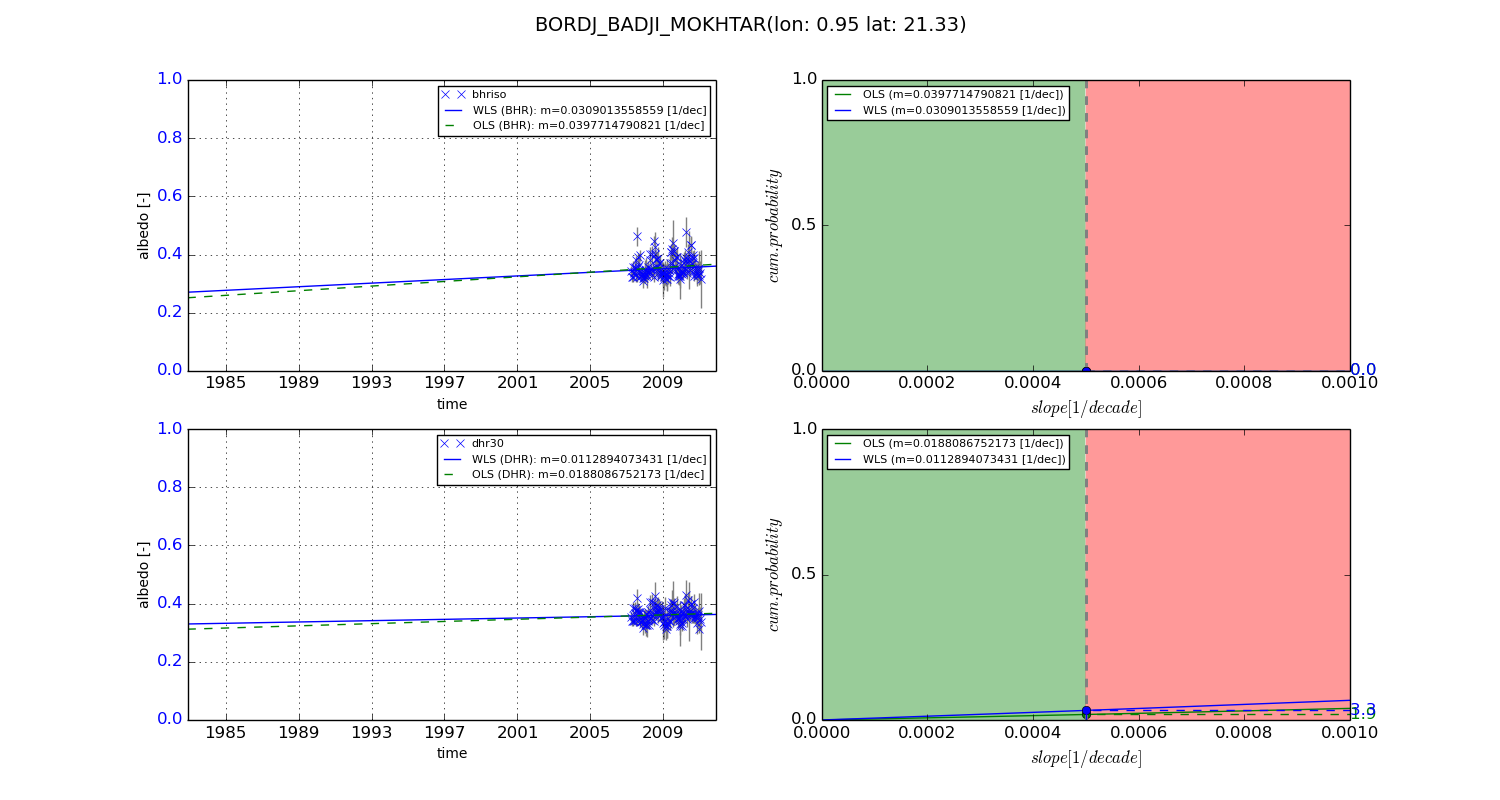
Temporal stability analysis

+000 deg (BHR)


BHR statistics

Temporal stability [1/decade]:


abs

rel


Weighted least square:

-0.00455652488898


Ordinary least square:

-0.00573280729862


Probabilities that GCOS criteria is met:

Weighted least square:

3.6 %

Ordinary least square:

3.3 %


DHR statistics

Temporal stability [1/decade]:


abs

rel


Weighted least square:

-0.00529142515309


Ordinary least square:

-0.000378104127847


Probabilities that GCOS criteria is met:

Weighted least square:

2.5 %

Ordinary least square:

24.7 %


+057/+063 deg (BHR)


BHR statistics

Temporal stability [1/decade]:


abs

rel


Weighted least square:

0.0309013558559


Ordinary least square:

0.0397714790821


Probabilities that GCOS criteria is met:

Weighted least square:

0.0 %

Ordinary least square:

0.0 %


DHR statistics

Temporal stability [1/decade]:


abs

rel


Weighted least square:

0.0112894073431


Ordinary least square:

0.0188086752173


Probabilities that GCOS criteria is met:

Weighted least square:

3.3 %

Ordinary least square:

1.9 %


Temporal anomaly analyis

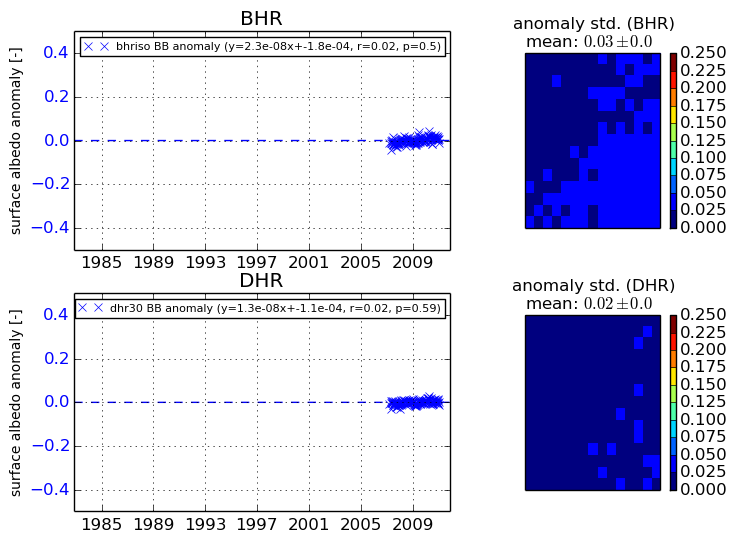
The variance of the temporal anomalies provides an additional measure about the stability of the signal AFTER removal of the mean seasonal cylce.
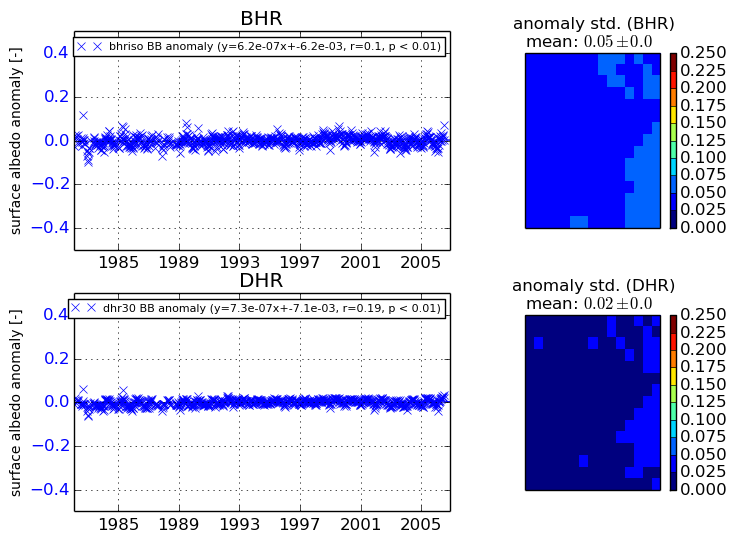
+000 deg


+057/+063 deg