BORDMAN


Location

lon / lat [deg]: -119.6667 / 45.8167

Source network: AERONET


Geostationary surface albedo (GSA) data


“+000”


“+057/+063”


Landcover information (based on ESA CCI landcover data)


Landcover fractions @ 2km distance


Landcover fractions @ 20 km distance


Legend


Distance to open water bodies [km]:

3.56

Distance to urban areas [km]:

1.83


Radius: 1 km

Number of landcover classes:

2

Dominant landcover type:

10: cropland, rainfed

Fraction of dominant landcover type [%]:

96.0


Radius: 2 km

Number of landcover classes:

4

Dominant landcover type:

10: cropland, rainfed

Fraction of dominant landcover type [%]:

77.0


Radius: 5 km

Number of landcover classes:

6

Dominant landcover type:

10: cropland, rainfed

Fraction of dominant landcover type [%]:

38.0


Radius: 10 km

Number of landcover classes:

6

Dominant landcover type:

10: cropland, rainfed

Fraction of dominant landcover type [%]:

38.0


Radius: 20 km

Number of landcover classes:

5

Dominant landcover type:

10: cropland, rainfed

Fraction of dominant landcover type [%]:

44.0


Disturbances


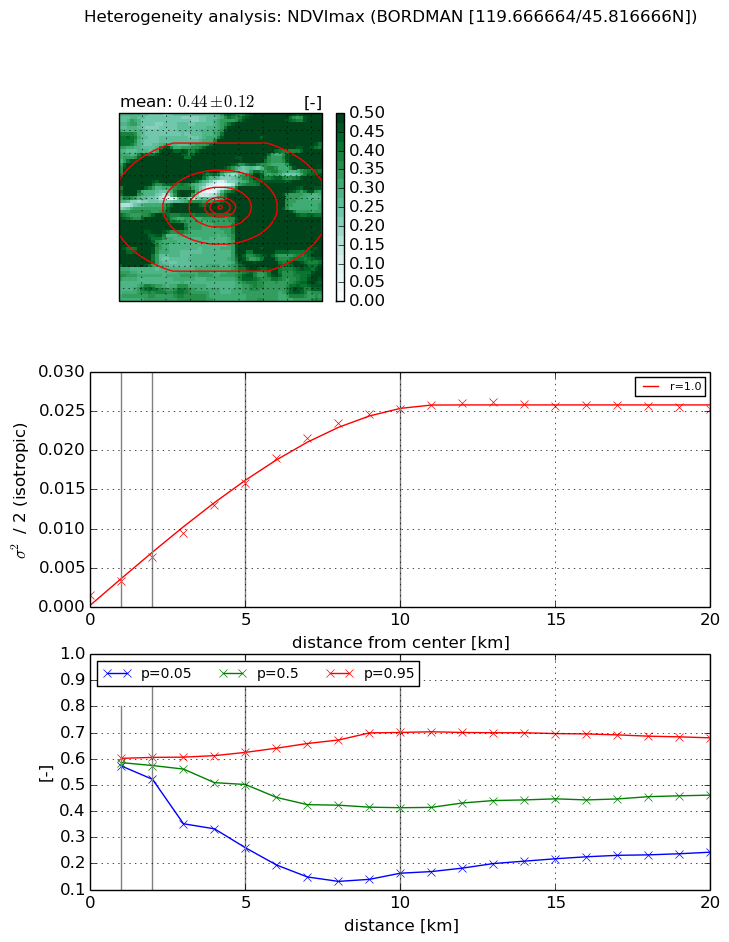
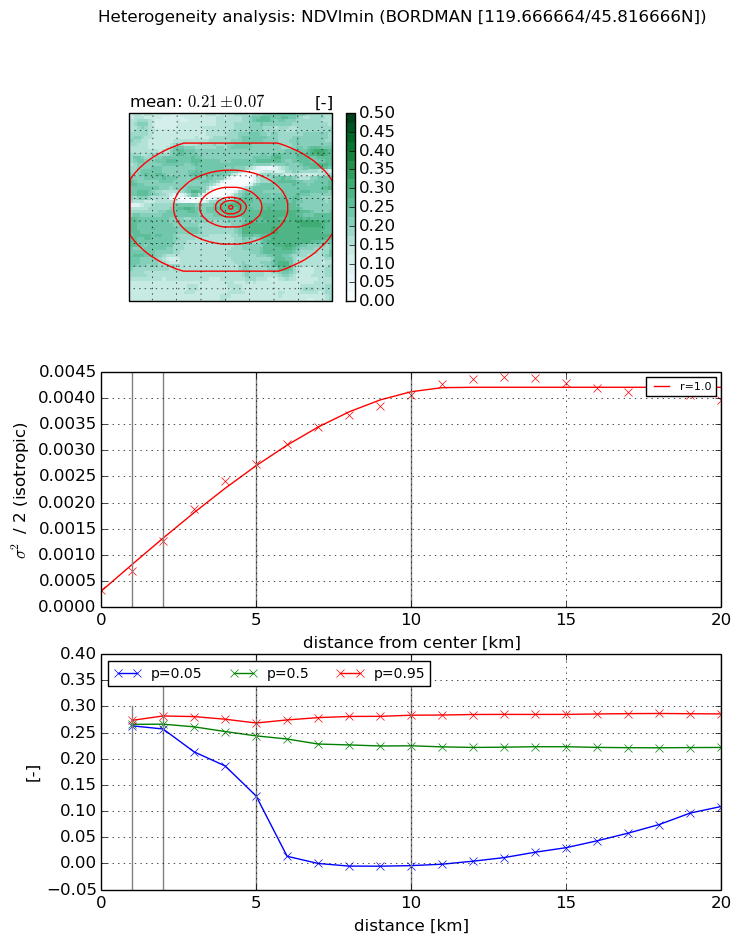
Heterogeneity analysis

The heterogeneity analysis provides information about the spatial and temporal heterogeneity of the site.

Topography


Roman et al. (2009) index


St

2.11547041531

Rcv

0.41807038491

Rse

0.0

Rst

-5.39142007195e-05

Rsv

-1.0


Height range @ 1km [m]

28

Height range @ 2km [m]

47

Height range @ 5km [m]

88

Height range @ 10km [m]

-999

Height range @ 20km [m]

-999


Variance slope @ 1 km

46

Variance slope @ 2 km

70

Variance slope @ 5 km

154

Variance slope @ 10 km

-999

Variance slope @ 20 km

-999


NDVI (max. NDVI composite)


Roman et al. (2009) index


St

1.76362394201

Rcv

0.638865585499

Rse

0.0

Rst

-0.0378990248952

Rsv

1.02427829821


NDVI range @ 1km [-]

0.03

NDVI range @ 2km [-]

0.08

NDVI range @ 5km [-]

0.36

NDVI range @ 10km [-]

0.54

NDVI range @ 20km [-]

0.44


Variance slope @ 1 km

0.00179366418701

Variance slope @ 2 km

0.00242482988057

Variance slope @ 5 km

0.00295010887062

Variance slope @ 10 km

0.00259350336678

Variance slope @ 20 km

0.00113957139284


NDVI (min. NDVI composite)I


Roman et al. (2009) index


St

0.907947744247

Rcv

2.21262899704

Rse

0.0

Rst

-0.0915260126452

Rsv

-0.999999903422


NDVI range @ 1km [-]

0.01

NDVI range @ 2km [-]

0.02

NDVI range @ 5km [-]

0.14

NDVI range @ 10km [-]

0.29

NDVI range @ 20km [-]

0.18


NDVI slope @ 1 km

0.000352350185184

NDVI slope @ 2 km

0.000465893918793

NDVI slope @ 5 km

0.000509061945038

NDVI slope @ 10 km

0.000384758655865

NDVI slope @ 20 km

0.000172957229813


Temporal stability analysis

+000 deg (BHR)


BHR statistics

Temporal stability [1/decade]:


abs

rel


Weighted least square:

None


Ordinary least square:

None


Probabilities that GCOS criteria is met:

Weighted least square:

None %

Ordinary least square:

None %


DHR statistics

Temporal stability [1/decade]:


abs

rel


Weighted least square:

None


Ordinary least square:

None


Probabilities that GCOS criteria is met:

Weighted least square:

None %

Ordinary least square:

None %


+057/+063 deg (BHR)


BHR statistics

Temporal stability [1/decade]:


abs

rel


Weighted least square:

None


Ordinary least square:

None


Probabilities that GCOS criteria is met:

Weighted least square:

None %

Ordinary least square:

None %


DHR statistics

Temporal stability [1/decade]:


abs

rel


Weighted least square:

None


Ordinary least square:

None


Probabilities that GCOS criteria is met:

Weighted least square:

None %

Ordinary least square:

None %


Temporal anomaly analyis

The variance of the temporal anomalies provides an additional measure about the stability of the signal AFTER removal of the mean seasonal cylce.

+000 deg


+057/+063 deg