BOREAS_NSA


Location

lon / lat [deg]: -98.48 / 55.87

Source network: EOS_LAND


Geostationary surface albedo (GSA) data


“+000”


“+057/+063”


Landcover information (based on ESA CCI landcover data)


Landcover fractions @ 2km distance


Landcover fractions @ 20 km distance


Legend


Distance to open water bodies [km]:

1.52

Distance to urban areas [km]:

none in region


Radius: 1 km

Number of landcover classes:

2

Dominant landcover type:

70: Tree cover, needleleaved, evergreen, closed to open (>15%)

Fraction of dominant landcover type [%]:

82.0


Radius: 2 km

Number of landcover classes:

4

Dominant landcover type:

70: Tree cover, needleleaved, evergreen, closed to open (>15%)

Fraction of dominant landcover type [%]:

71.0


Radius: 5 km

Number of landcover classes:

4

Dominant landcover type:

70: Tree cover, needleleaved, evergreen, closed to open (>15%)

Fraction of dominant landcover type [%]:

68.0


Radius: 10 km

Number of landcover classes:

5

Dominant landcover type:

70: Tree cover, needleleaved, evergreen, closed to open (>15%)

Fraction of dominant landcover type [%]:

57.0


Radius: 20 km

Number of landcover classes:

4

Dominant landcover type:

70: Tree cover, needleleaved, evergreen, closed to open (>15%)

Fraction of dominant landcover type [%]:

77.0


Disturbances


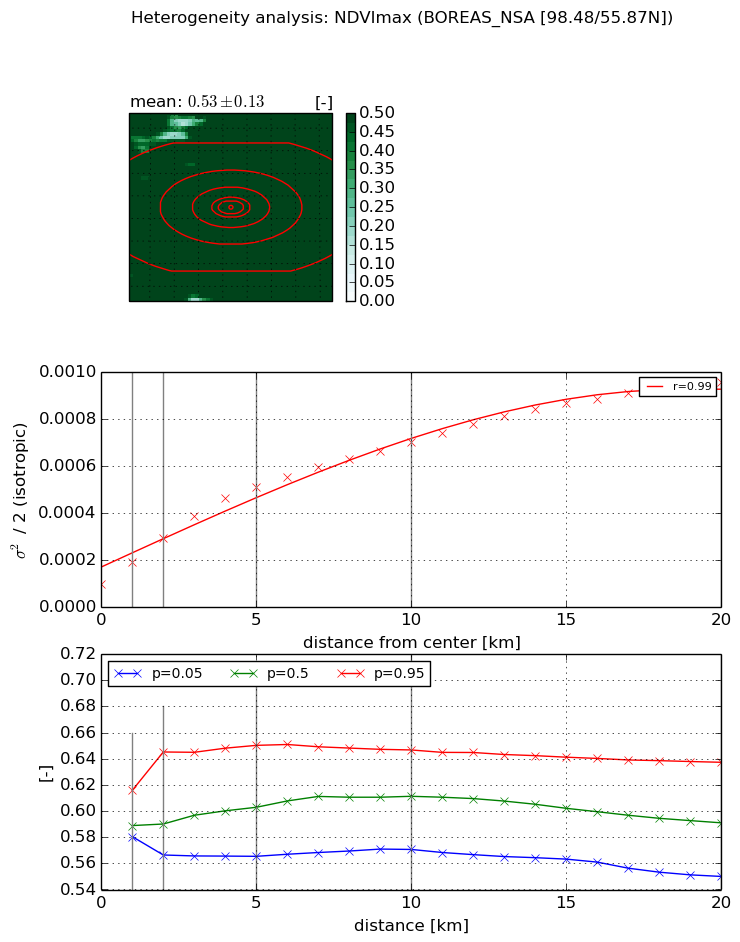
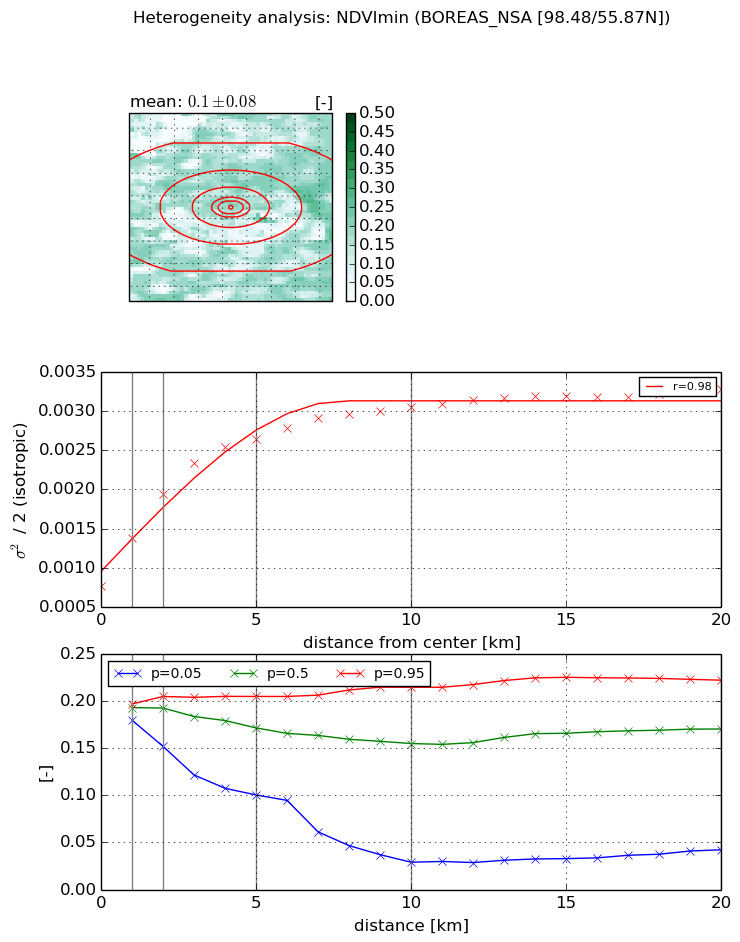
Heterogeneity analysis

The heterogeneity analysis provides information about the spatial and temporal heterogeneity of the site.

Topography


Roman et al. (2009) index


St

8.30966589713

Rcv

0.112509657433

Rse

0.0

Rst

0.0279895190878

Rsv

-0.220526168799


Height range @ 1km [m]

19

Height range @ 2km [m]

28

Height range @ 5km [m]

31

Height range @ 10km [m]

-999

Height range @ 20km [m]

-999


Variance slope @ 1 km

51

Variance slope @ 2 km

33

Variance slope @ 5 km

19

Variance slope @ 10 km

-999

Variance slope @ 20 km

-999


NDVI (max. NDVI composite)


Roman et al. (2009) index


St

5.00125696368

Rcv

0.0606887865466

Rse

0.0

Rst

0.011471172031

Rsv

0.52768924369


NDVI range @ 1km [-]

0.04

NDVI range @ 2km [-]

0.08

NDVI range @ 5km [-]

0.08

NDVI range @ 10km [-]

0.08

NDVI range @ 20km [-]

0.09


Variance slope @ 1 km

9.24213377267e-05

Variance slope @ 2 km

9.86225805767e-05

Variance slope @ 5 km

8.51095449665e-05

Variance slope @ 10 km

5.84247240456e-05

Variance slope @ 20 km

3.96087301531e-05


NDVI (min. NDVI composite)I


Roman et al. (2009) index


St

2.67157736876

Rcv

0.402260160338

Rse

0.0

Rst

0.0828995926569

Rsv

0.637772352614


NDVI range @ 1km [-]

0.02

NDVI range @ 2km [-]

0.05

NDVI range @ 5km [-]

0.1

NDVI range @ 10km [-]

0.19

NDVI range @ 20km [-]

0.18


NDVI slope @ 1 km

0.000613880632073

NDVI slope @ 2 km

0.000587654919428

NDVI slope @ 5 km

0.00037976357779

NDVI slope @ 10 km

0.000202935991518

NDVI slope @ 20 km

8.76653564684e-05


Temporal stability analysis

+000 deg (BHR)


BHR statistics

Temporal stability [1/decade]:


abs

rel


Weighted least square:

None


Ordinary least square:

None


Probabilities that GCOS criteria is met:

Weighted least square:

None %

Ordinary least square:

None %


DHR statistics

Temporal stability [1/decade]:


abs

rel


Weighted least square:

None


Ordinary least square:

None


Probabilities that GCOS criteria is met:

Weighted least square:

None %

Ordinary least square:

None %


+057/+063 deg (BHR)


BHR statistics

Temporal stability [1/decade]:


abs

rel


Weighted least square:

None


Ordinary least square:

None


Probabilities that GCOS criteria is met:

Weighted least square:

None %

Ordinary least square:

None %


DHR statistics

Temporal stability [1/decade]:


abs

rel


Weighted least square:

None


Ordinary least square:

None


Probabilities that GCOS criteria is met:

Weighted least square:

None %

Ordinary least square:

None %


Temporal anomaly analyis

The variance of the temporal anomalies provides an additional measure about the stability of the signal AFTER removal of the mean seasonal cylce.

+000 deg


+057/+063 deg