BR-SA3


Location

lon / lat [deg]: -54.9714 / -3.018

Source network: FLUXNET


Geostationary surface albedo (GSA) data


“+000”


“+057/+063”


Landcover information (based on ESA CCI landcover data)


Landcover fractions @ 2km distance


Landcover fractions @ 20 km distance


Legend


Distance to open water bodies [km]:

12.04

Distance to urban areas [km]:

13.34


Radius: 1 km

Number of landcover classes:

1

Dominant landcover type:

50: Tree cover, broadleaved, evergreen, closed to open (>15%)

Fraction of dominant landcover type [%]:

100.0


Radius: 2 km

Number of landcover classes:

1

Dominant landcover type:

50: Tree cover, broadleaved, evergreen, closed to open (>15%)

Fraction of dominant landcover type [%]:

100.0


Radius: 5 km

Number of landcover classes:

1

Dominant landcover type:

50: Tree cover, broadleaved, evergreen, closed to open (>15%)

Fraction of dominant landcover type [%]:

100.0


Radius: 10 km

Number of landcover classes:

2

Dominant landcover type:

50: Tree cover, broadleaved, evergreen, closed to open (>15%)

Fraction of dominant landcover type [%]:

96.0


Radius: 20 km

Number of landcover classes:

4

Dominant landcover type:

50: Tree cover, broadleaved, evergreen, closed to open (>15%)

Fraction of dominant landcover type [%]:

82.0


Disturbances


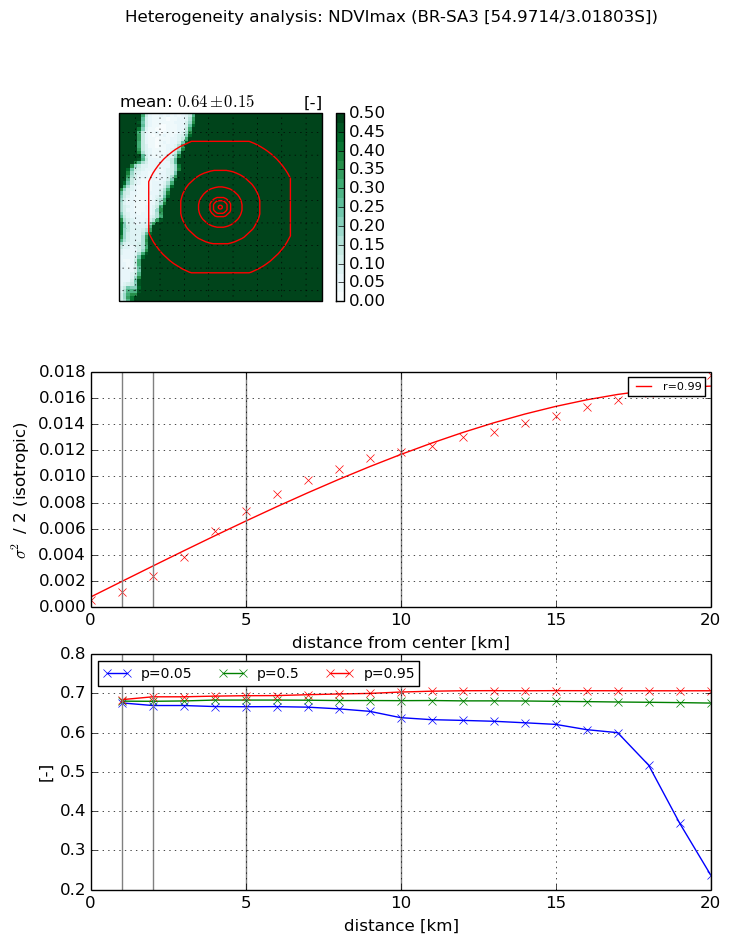
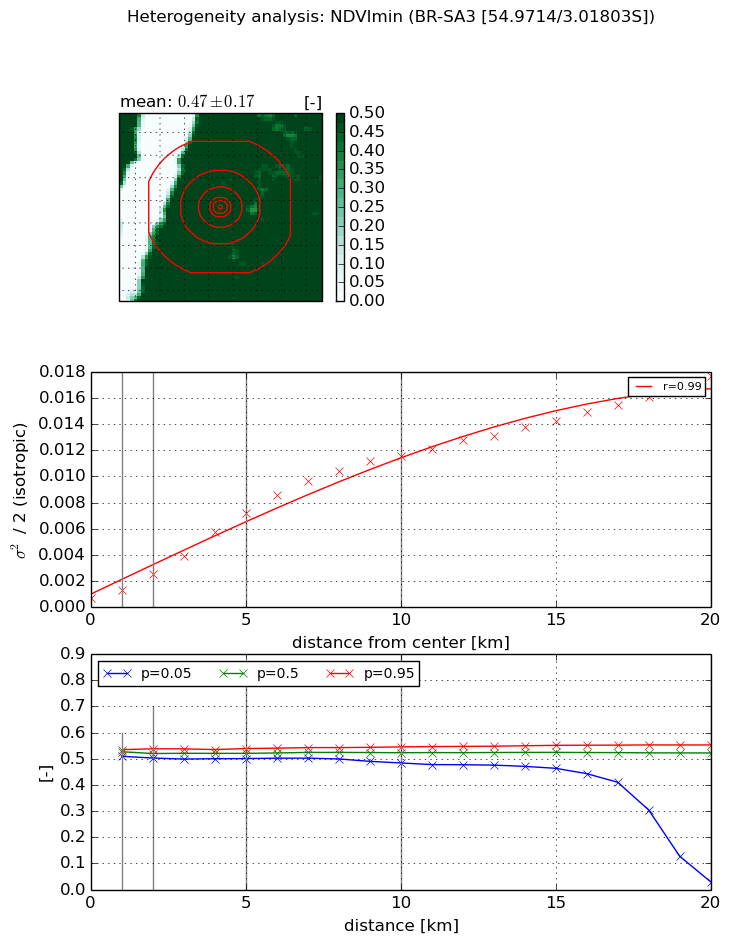
Heterogeneity analysis

The heterogeneity analysis provides information about the spatial and temporal heterogeneity of the site.

Topography


Roman et al. (2009) index


St

0.0760785905188

Rcv

0.382265595898

Rse

0.0

Rst

9.43907372409e-05

Rsv

39.0505472155


Height range @ 1km [m]

26

Height range @ 2km [m]

48

Height range @ 5km [m]

91

Height range @ 10km [m]

-999

Height range @ 20km [m]

-999


Variance slope @ 1 km

40

Variance slope @ 2 km

81

Variance slope @ 5 km

190

Variance slope @ 10 km

-999

Variance slope @ 20 km

-999


NDVI (max. NDVI composite)


Roman et al. (2009) index


St

0.74338959921

Rcv

0.224746264255

Rse

0.0

Rst

-0.0149736582967

Rsv

3.79584904853


NDVI range @ 1km [-]

0.01

NDVI range @ 2km [-]

0.02

NDVI range @ 5km [-]

0.03

NDVI range @ 10km [-]

0.07

NDVI range @ 20km [-]

0.47


Variance slope @ 1 km

0.000590340782102

Variance slope @ 2 km

0.000910521024775

Variance slope @ 5 km

0.00140613640742

Variance slope @ 10 km

0.00123993631357

Variance slope @ 20 km

0.000838890063452


NDVI (min. NDVI composite)I


Roman et al. (2009) index


St

6.10336472146

Rcv

-0.113206757283

Rse

0.0

Rst

-0.0756194320397

Rsv

-0.302705963335


NDVI range @ 1km [-]

0.03

NDVI range @ 2km [-]

0.04

NDVI range @ 5km [-]

0.04

NDVI range @ 10km [-]

0.06

NDVI range @ 20km [-]

0.52


NDVI slope @ 1 km

0.000622022339826

NDVI slope @ 2 km

0.000916042213432

NDVI slope @ 5 km

0.00134803106608

NDVI slope @ 10 km

0.00119687007038

NDVI slope @ 20 km

0.000815107377969


Temporal stability analysis

+000 deg (BHR)


BHR statistics

Temporal stability [1/decade]:


abs

rel


Weighted least square:

-99999.0


Ordinary least square:

-99999.0


Probabilities that GCOS criteria is met:

Weighted least square:

-99999.0 %

Ordinary least square:

-99999.0 %


DHR statistics

Temporal stability [1/decade]:


abs

rel


Weighted least square:

-99999.0


Ordinary least square:

-99999.0


Probabilities that GCOS criteria is met:

Weighted least square:

-99999.0 %

Ordinary least square:

-99999.0 %


+057/+063 deg (BHR)


BHR statistics

Temporal stability [1/decade]:


abs

rel


Weighted least square:

None


Ordinary least square:

None


Probabilities that GCOS criteria is met:

Weighted least square:

None %

Ordinary least square:

None %


DHR statistics

Temporal stability [1/decade]:


abs

rel


Weighted least square:

None


Ordinary least square:

None


Probabilities that GCOS criteria is met:

Weighted least square:

None %

Ordinary least square:

None %


Temporal anomaly analyis

The variance of the temporal anomalies provides an additional measure about the stability of the signal AFTER removal of the mean seasonal cylce.

+000 deg


+057/+063 deg