BRB


Location

lon / lat [deg]: -47.713 / -15.601

Source network: BSRN


Geostationary surface albedo (GSA) data


“+000”


“+057/+063”


Landcover information (based on ESA CCI landcover data)


Landcover fractions @ 2km distance


Landcover fractions @ 20 km distance


Legend


Distance to open water bodies [km]:

2.38

Distance to urban areas [km]:

2.24


Radius: 1 km

Number of landcover classes:

2

Dominant landcover type:

10: cropland, rainfed

Fraction of dominant landcover type [%]:

88.0


Radius: 2 km

Number of landcover classes:

4

Dominant landcover type:

10: cropland, rainfed

Fraction of dominant landcover type [%]:

68.0


Radius: 5 km

Number of landcover classes:

6

Dominant landcover type:

10: cropland, rainfed

Fraction of dominant landcover type [%]:

55.0


Radius: 10 km

Number of landcover classes:

5

Dominant landcover type:

10: cropland, rainfed

Fraction of dominant landcover type [%]:

46.0


Radius: 20 km

Number of landcover classes:

9

Dominant landcover type:

10: cropland, rainfed

Fraction of dominant landcover type [%]:

43.0


Disturbances


Heterogeneity analysis

The heterogeneity analysis provides information about the spatial and temporal heterogeneity of the site.

Topography


Roman et al. (2009) index


St

2.37831832178

Rcv

0.261394724168

Rse

0.0

Rst

-1.18817582284e-06

Rsv

-0.999999575608


Height range @ 1km [m]

63

Height range @ 2km [m]

141

Height range @ 5km [m]

211

Height range @ 10km [m]

-999

Height range @ 20km [m]

-999


Variance slope @ 1 km

543

Variance slope @ 2 km

738

Variance slope @ 5 km

1037

Variance slope @ 10 km

-999

Variance slope @ 20 km

-999


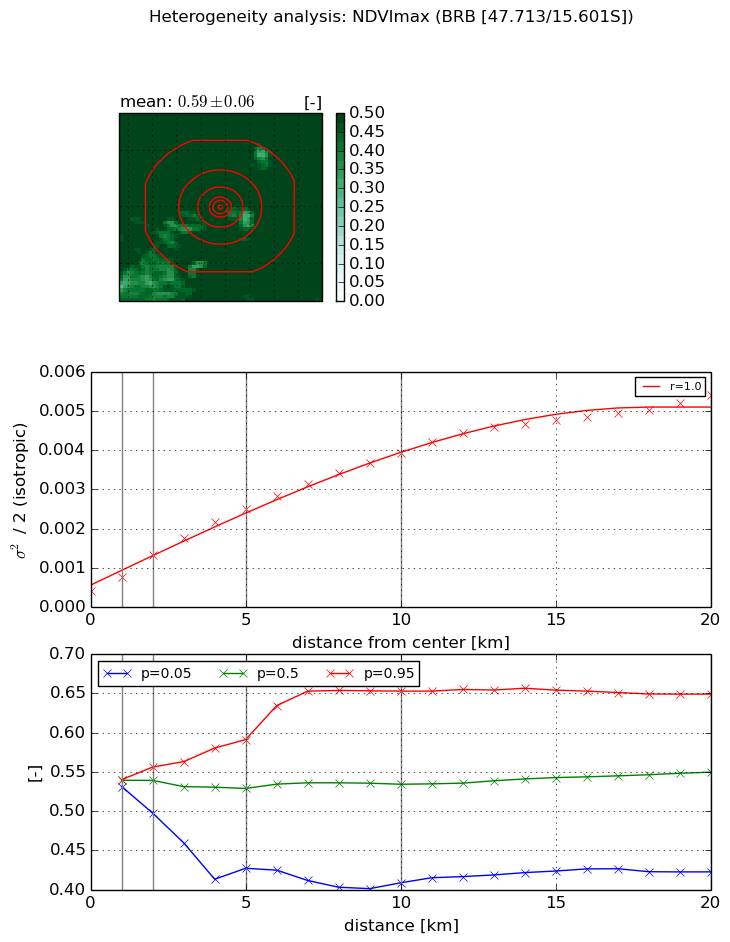
NDVI (max. NDVI composite)


Roman et al. (2009) index


St

1.73452987348

Rcv

0.45036785715

Rse

0.0

Rst

-0.279207531582

Rsv

-0.999999896116


NDVI range @ 1km [-]

0.01

NDVI range @ 2km [-]

0.06

NDVI range @ 5km [-]

0.16

NDVI range @ 10km [-]

0.24

NDVI range @ 20km [-]

0.23


Variance slope @ 1 km

0.000347625522678

Variance slope @ 2 km

0.000449429112319

Variance slope @ 5 km

0.00042959872186

Variance slope @ 10 km

0.000352902810059

Variance slope @ 20 km

0.000238323237311


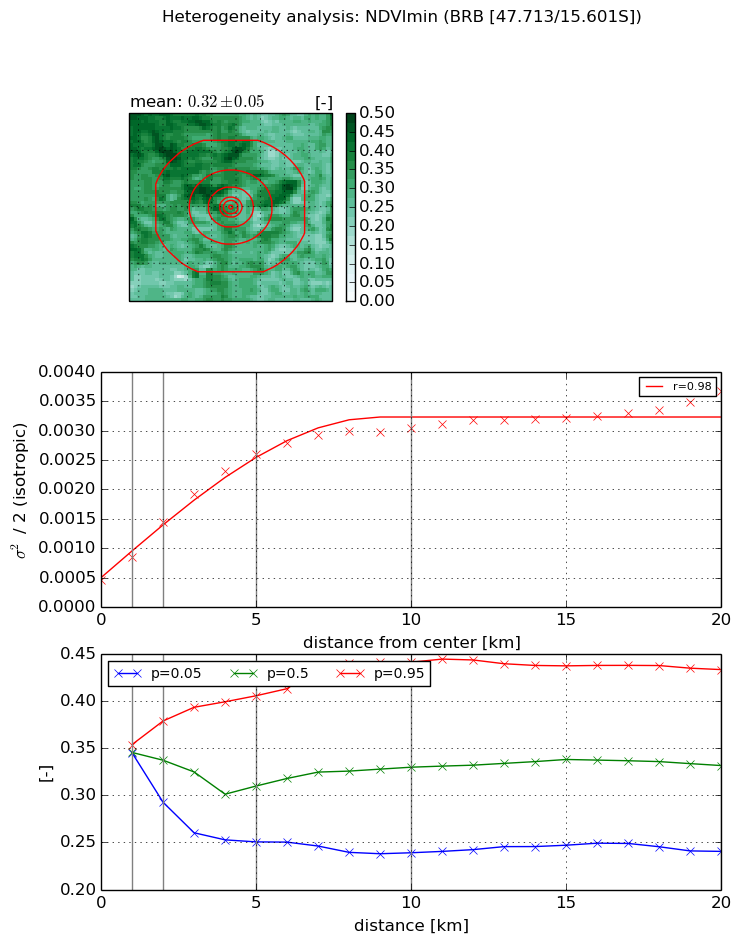
NDVI (min. NDVI composite)I


Roman et al. (2009) index


St

2.82747703601e-07

Rcv

0.11637138733

Rse

0.0

Rst

0.197588543705

Rsv

10610165.4338


NDVI range @ 1km [-]

0.01

NDVI range @ 2km [-]

0.09

NDVI range @ 5km [-]

0.16

NDVI range @ 10km [-]

0.2

NDVI range @ 20km [-]

0.19


NDVI slope @ 1 km

0.000385594682961

NDVI slope @ 2 km

0.000491801101344

NDVI slope @ 5 km

0.000444809352741

NDVI slope @ 10 km

0.00025878972385

NDVI slope @ 20 km

0.000119869896711


Temporal stability analysis

+000 deg (BHR)


BHR statistics

Temporal stability [1/decade]:


abs

rel


Weighted least square:

-99999.0


Ordinary least square:

-99999.0


Probabilities that GCOS criteria is met:

Weighted least square:

-99999.0 %

Ordinary least square:

-99999.0 %


DHR statistics

Temporal stability [1/decade]:


abs

rel


Weighted least square:

-99999.0


Ordinary least square:

-99999.0


Probabilities that GCOS criteria is met:

Weighted least square:

-99999.0 %

Ordinary least square:

-99999.0 %


+057/+063 deg (BHR)


BHR statistics

Temporal stability [1/decade]:


abs

rel


Weighted least square:

None


Ordinary least square:

None


Probabilities that GCOS criteria is met:

Weighted least square:

None %

Ordinary least square:

None %


DHR statistics

Temporal stability [1/decade]:


abs

rel


Weighted least square:

None


Ordinary least square:

None


Probabilities that GCOS criteria is met:

Weighted least square:

None %

Ordinary least square:

None %


Temporal anomaly analyis

The variance of the temporal anomalies provides an additional measure about the stability of the signal AFTER removal of the mean seasonal cylce.

+000 deg


+057/+063 deg