BRUSSELS


Location

lon / lat [deg]: 4.35 / 50.7833

Source network: AERONET


Geostationary surface albedo (GSA) data


“+000”


“+057/+063”


Landcover information (based on ESA CCI landcover data)


Landcover fractions @ 2km distance


Landcover fractions @ 20 km distance


Legend


Distance to open water bodies [km]:

13.31

Distance to urban areas [km]:

0.18


Radius: 1 km

Number of landcover classes:

1

Dominant landcover type:

190: urban areas

Fraction of dominant landcover type [%]:

100.0


Radius: 2 km

Number of landcover classes:

2

Dominant landcover type:

190: urban areas

Fraction of dominant landcover type [%]:

96.0


Radius: 5 km

Number of landcover classes:

3

Dominant landcover type:

190: urban areas

Fraction of dominant landcover type [%]:

86.0


Radius: 10 km

Number of landcover classes:

5

Dominant landcover type:

190: urban areas

Fraction of dominant landcover type [%]:

73.0


Radius: 20 km

Number of landcover classes:

5

Dominant landcover type:

190: urban areas

Fraction of dominant landcover type [%]:

55.0


Disturbances


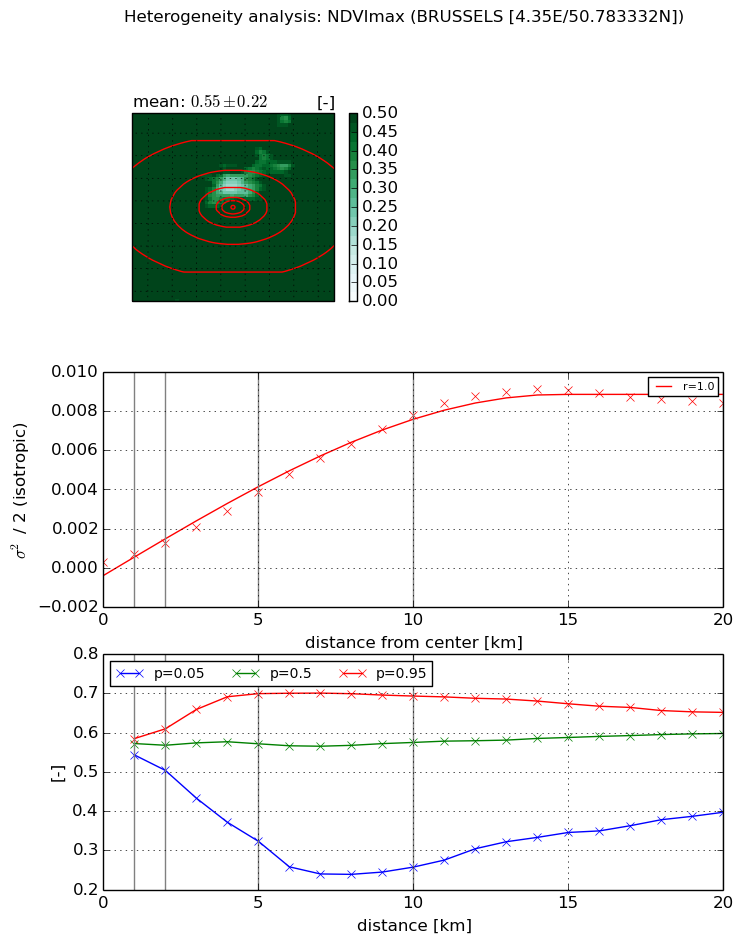
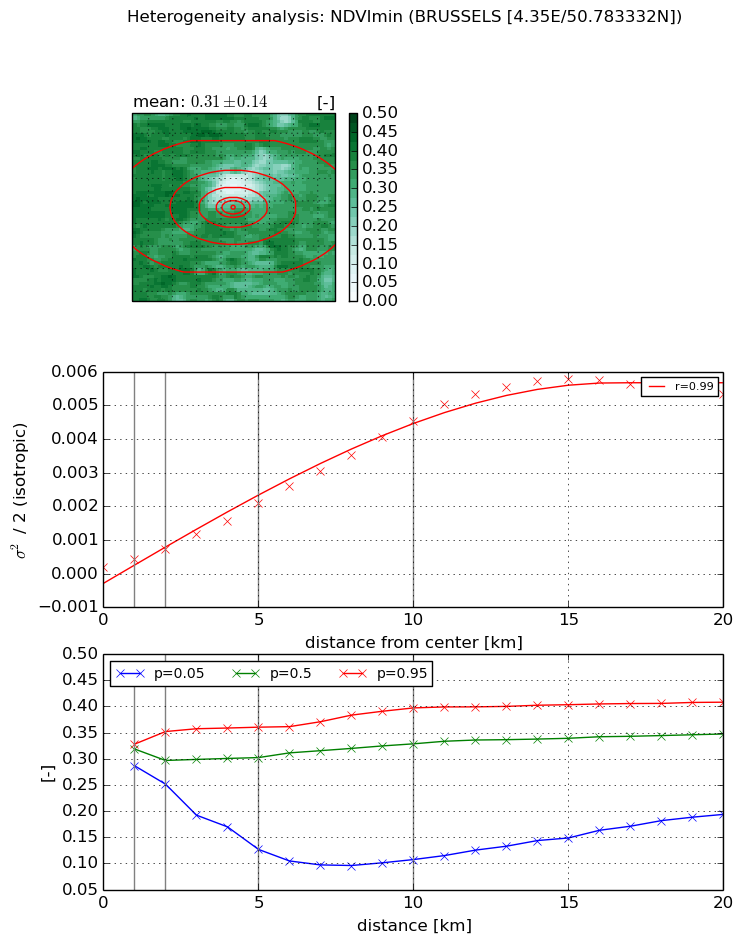
Heterogeneity analysis

The heterogeneity analysis provides information about the spatial and temporal heterogeneity of the site.

Topography


Roman et al. (2009) index


St

5.11403778137

Rcv

0.252678023729

Rse

0.0

Rst

-2.7324619521e-06

Rsv

-0.33393986107


Height range @ 1km [m]

59

Height range @ 2km [m]

71

Height range @ 5km [m]

109

Height range @ 10km [m]

-999

Height range @ 20km [m]

-999


Variance slope @ 1 km

192

Variance slope @ 2 km

198

Variance slope @ 5 km

225

Variance slope @ 10 km

-999

Variance slope @ 20 km

-999


NDVI (max. NDVI composite)


Roman et al. (2009) index


St

4.21838678502e-07

Rcv

0.845397643365

Rse

0.0

Rst

0.130632941636

Rsv

7111722.42177


NDVI range @ 1km [-]

0.04

NDVI range @ 2km [-]

0.11

NDVI range @ 5km [-]

0.38

NDVI range @ 10km [-]

0.44

NDVI range @ 20km [-]

0.25


Variance slope @ 1 km

0.000395087962267

Variance slope @ 2 km

0.000495076580473

Variance slope @ 5 km

0.000724199320471

Variance slope @ 10 km

0.000792111979875

Variance slope @ 20 km

0.000458217626933


NDVI (min. NDVI composite)I


Roman et al. (2009) index


St

3.00294881922

Rcv

0.625341235942

Rse

0.0

Rst

-0.12563170693

Rsv

-0.248045082611


NDVI range @ 1km [-]

0.04

NDVI range @ 2km [-]

0.1

NDVI range @ 5km [-]

0.23

NDVI range @ 10km [-]

0.29

NDVI range @ 20km [-]

0.21


NDVI slope @ 1 km

0.000238499608668

NDVI slope @ 2 km

0.000278908401463

NDVI slope @ 5 km

0.000381778767267

NDVI slope @ 10 km

0.000450117400281

NDVI slope @ 20 km

0.000306296099625


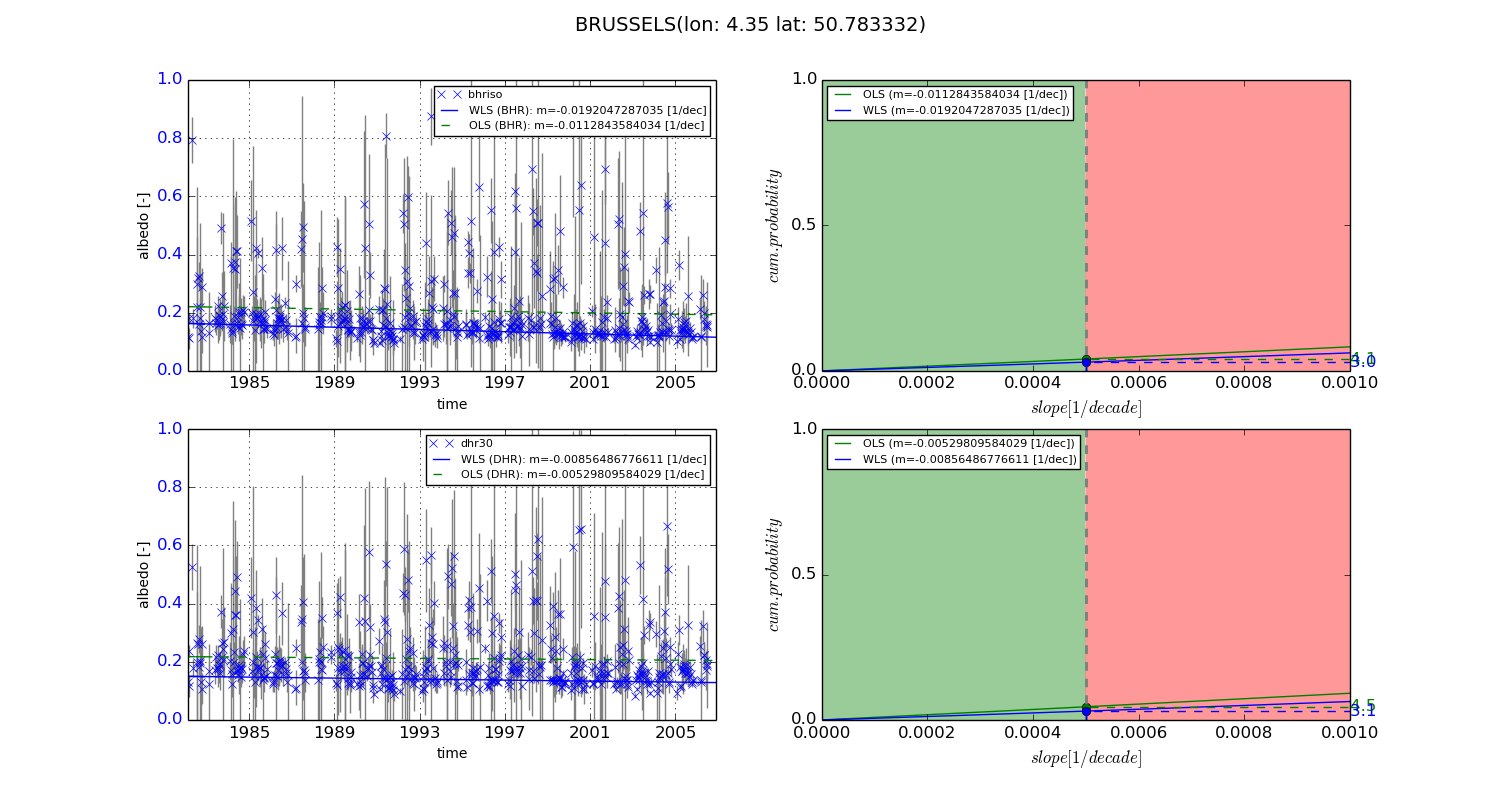
Temporal stability analysis

+000 deg (BHR)


BHR statistics

Temporal stability [1/decade]:


abs

rel


Weighted least square:

-0.0192047287035


Ordinary least square:

-0.0112843584034


Probabilities that GCOS criteria is met:

Weighted least square:

3.0 %

Ordinary least square:

4.1 %


DHR statistics

Temporal stability [1/decade]:


abs

rel


Weighted least square:

-0.00856486776611


Ordinary least square:

-0.00529809584029


Probabilities that GCOS criteria is met:

Weighted least square:

3.1 %

Ordinary least square:

4.5 %


+057/+063 deg (BHR)


BHR statistics

Temporal stability [1/decade]:


abs

rel


Weighted least square:

-99999.0


Ordinary least square:

-99999.0


Probabilities that GCOS criteria is met:

Weighted least square:

-99999.0 %

Ordinary least square:

-99999.0 %


DHR statistics

Temporal stability [1/decade]:


abs

rel


Weighted least square:

-99999.0


Ordinary least square:

-99999.0


Probabilities that GCOS criteria is met:

Weighted least square:

-99999.0 %

Ordinary least square:

-99999.0 %


Temporal anomaly analyis

The variance of the temporal anomalies provides an additional measure about the stability of the signal AFTER removal of the mean seasonal cylce.
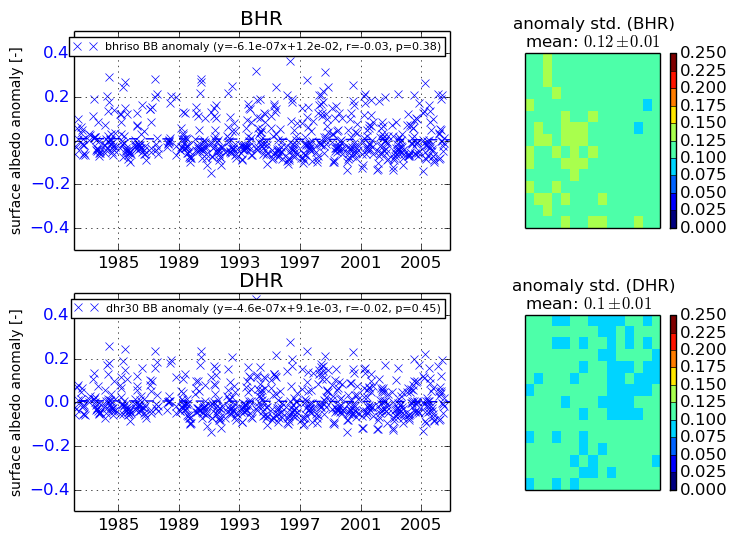
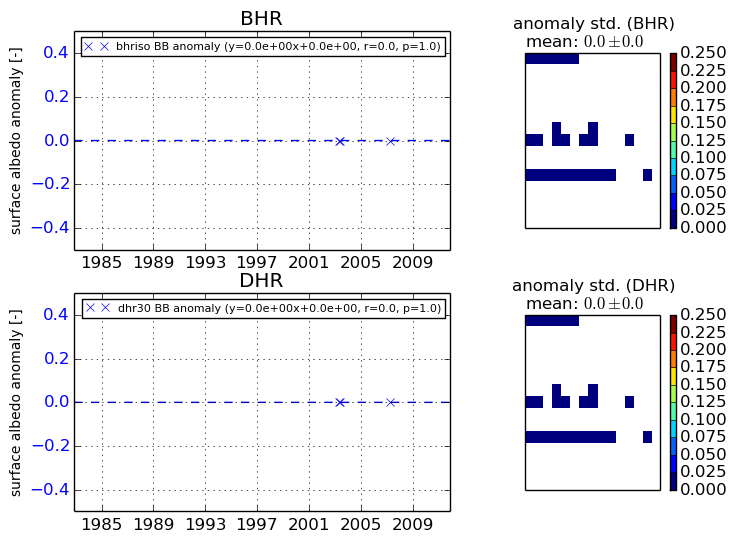
+000 deg


+057/+063 deg