BSRN_BAO_BOULDER


Location

lon / lat [deg]: -105.006 / 40.0452

Source network: AERONET


Geostationary surface albedo (GSA) data


“+000”


“+057/+063”


Landcover information (based on ESA CCI landcover data)


Landcover fractions @ 2km distance


Landcover fractions @ 20 km distance


Legend


Distance to open water bodies [km]:

4.99

Distance to urban areas [km]:

2.7


Radius: 1 km

Number of landcover classes:

2

Dominant landcover type:

130: grassland

Fraction of dominant landcover type [%]:

95.0


Radius: 2 km

Number of landcover classes:

3

Dominant landcover type:

130: grassland

Fraction of dominant landcover type [%]:

85.0


Radius: 5 km

Number of landcover classes:

3

Dominant landcover type:

130: grassland

Fraction of dominant landcover type [%]:

87.0


Radius: 10 km

Number of landcover classes:

5

Dominant landcover type:

130: grassland

Fraction of dominant landcover type [%]:

72.0


Radius: 20 km

Number of landcover classes:

6

Dominant landcover type:

130: grassland

Fraction of dominant landcover type [%]:

56.0


Disturbances


Heterogeneity analysis

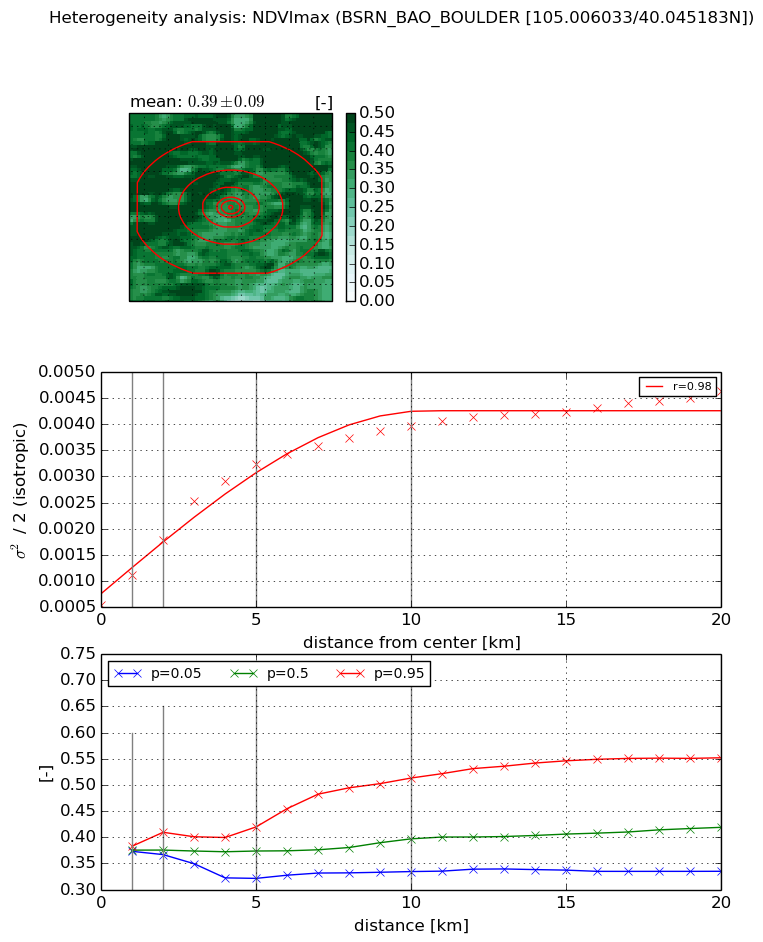
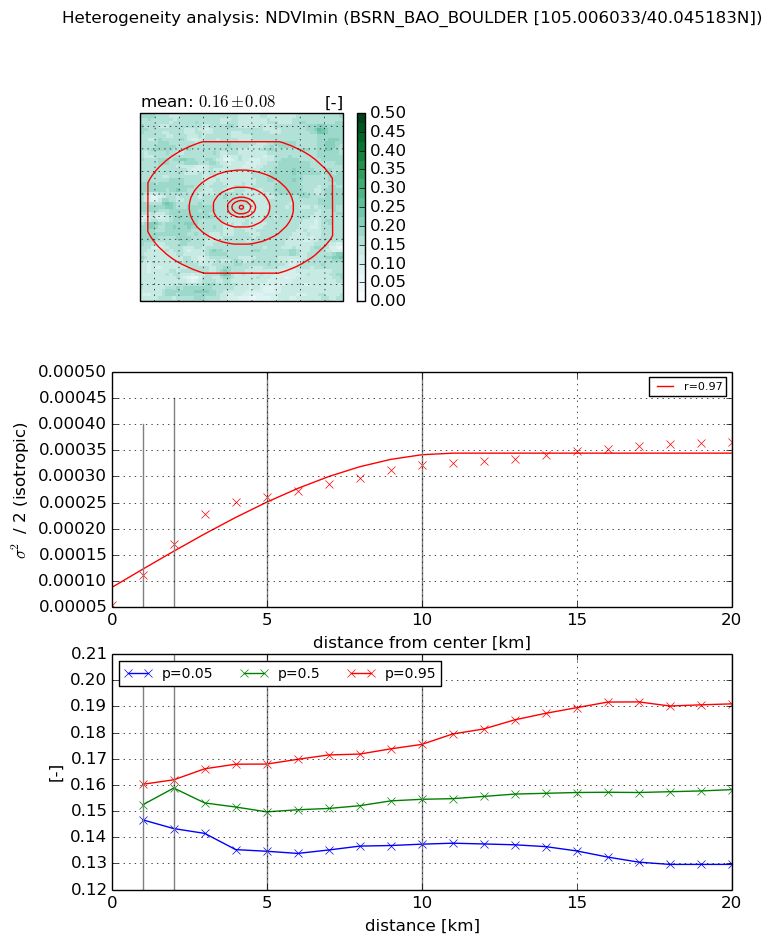
The heterogeneity analysis provides information about the spatial and temporal heterogeneity of the site.

Topography


Roman et al. (2009) index


St

2.94265164329

Rcv

0.278894904518

Rse

0.0

Rst

-6.92404741655e-06

Rsv

-0.740586838004


Height range @ 1km [m]

31

Height range @ 2km [m]

42

Height range @ 5km [m]

75

Height range @ 10km [m]

-999

Height range @ 20km [m]

-999


Variance slope @ 1 km

94

Variance slope @ 2 km

117

Variance slope @ 5 km

153

Variance slope @ 10 km

-999

Variance slope @ 20 km

-999


NDVI (max. NDVI composite)


Roman et al. (2009) index


St

1.62125983808

Rcv

0.55367520476

Rse

0.0

Rst

-0.296737684134

Rsv

-0.999999937934


NDVI range @ 1km [-]

0.01

NDVI range @ 2km [-]

0.04

NDVI range @ 5km [-]

0.1

NDVI range @ 10km [-]

0.18

NDVI range @ 20km [-]

0.22


Variance slope @ 1 km

0.000580815550882

Variance slope @ 2 km

0.000626955577011

Variance slope @ 5 km

0.000561174061015

Variance slope @ 10 km

0.000333071395723

Variance slope @ 20 km

0.000162188759076


NDVI (min. NDVI composite)I


Roman et al. (2009) index


St

3.69137334942

Rcv

0.308348235361

Rse

0.0

Rst

0.0243228567781

Rsv

0.480034564001


NDVI range @ 1km [-]

0.01

NDVI range @ 2km [-]

0.02

NDVI range @ 5km [-]

0.03

NDVI range @ 10km [-]

0.04

NDVI range @ 20km [-]

0.06


NDVI slope @ 1 km

5.63028050953e-05

NDVI slope @ 2 km

5.80886544079e-05

NDVI slope @ 5 km

4.31730307932e-05

NDVI slope @ 10 km

2.41026353831e-05

NDVI slope @ 20 km

1.21953354512e-05


Temporal stability analysis

+000 deg (BHR)


BHR statistics

Temporal stability [1/decade]:


abs

rel


Weighted least square:

None


Ordinary least square:

None


Probabilities that GCOS criteria is met:

Weighted least square:

None %

Ordinary least square:

None %


DHR statistics

Temporal stability [1/decade]:


abs

rel


Weighted least square:

None


Ordinary least square:

None


Probabilities that GCOS criteria is met:

Weighted least square:

None %

Ordinary least square:

None %


+057/+063 deg (BHR)


BHR statistics

Temporal stability [1/decade]:


abs

rel


Weighted least square:

None


Ordinary least square:

None


Probabilities that GCOS criteria is met:

Weighted least square:

None %

Ordinary least square:

None %


DHR statistics

Temporal stability [1/decade]:


abs

rel


Weighted least square:

None


Ordinary least square:

None


Probabilities that GCOS criteria is met:

Weighted least square:

None %

Ordinary least square:

None %


Temporal anomaly analyis

The variance of the temporal anomalies provides an additional measure about the stability of the signal AFTER removal of the mean seasonal cylce.

+000 deg


+057/+063 deg