BUCAREST


Location

lon / lat [deg]: 26.525 / 44.45

Source network: AERONET


Geostationary surface albedo (GSA) data


“+000”


“+057/+063”


Landcover information (based on ESA CCI landcover data)


Landcover fractions @ 2km distance


Landcover fractions @ 20 km distance


Legend


Distance to open water bodies [km]:

2.47

Distance to urban areas [km]:

0.19


Radius: 1 km

Number of landcover classes:

2

Dominant landcover type:

10: cropland, rainfed

Fraction of dominant landcover type [%]:

82.0


Radius: 2 km

Number of landcover classes:

2

Dominant landcover type:

10: cropland, rainfed

Fraction of dominant landcover type [%]:

88.0


Radius: 5 km

Number of landcover classes:

5

Dominant landcover type:

10: cropland, rainfed

Fraction of dominant landcover type [%]:

87.0


Radius: 10 km

Number of landcover classes:

4

Dominant landcover type:

10: cropland, rainfed

Fraction of dominant landcover type [%]:

90.0


Radius: 20 km

Number of landcover classes:

4

Dominant landcover type:

10: cropland, rainfed

Fraction of dominant landcover type [%]:

85.0


Disturbances


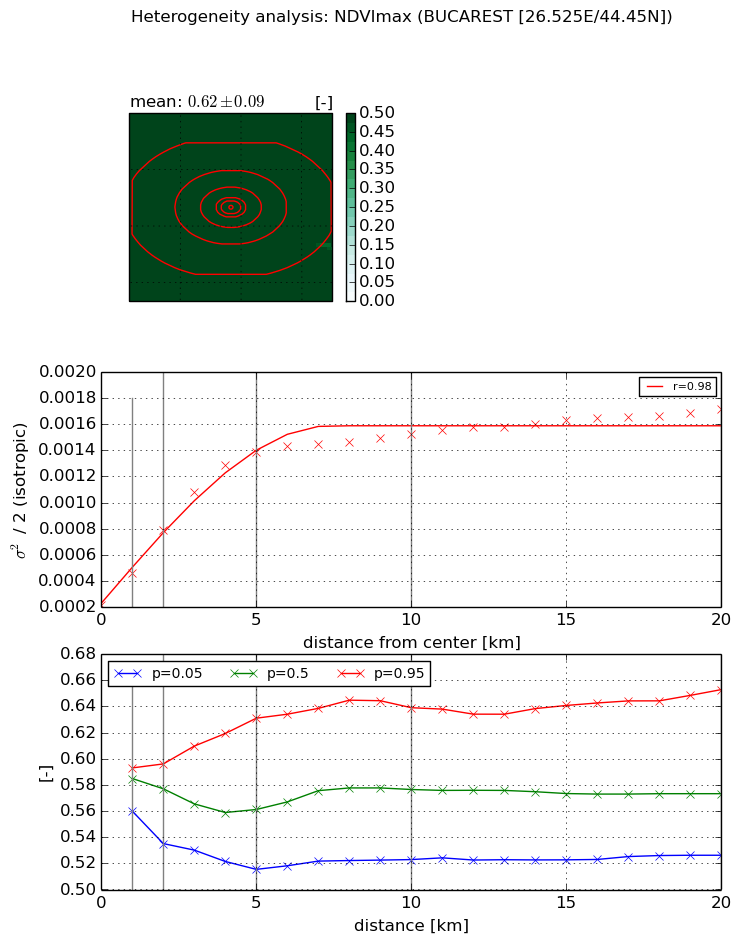
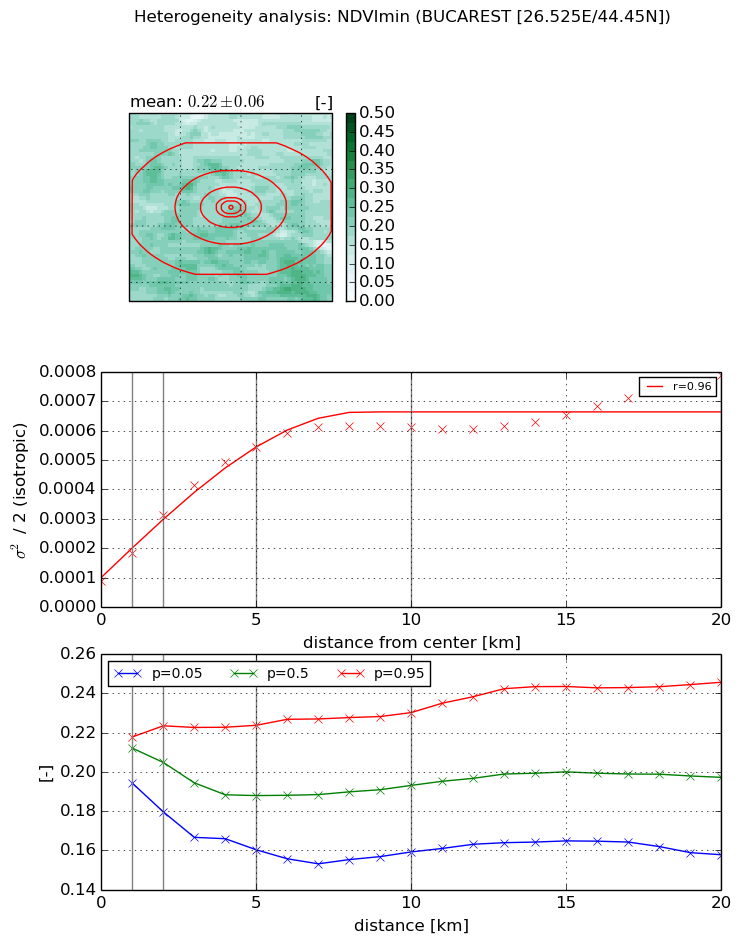
Heterogeneity analysis

The heterogeneity analysis provides information about the spatial and temporal heterogeneity of the site.

Topography


Roman et al. (2009) index


St

1.67240077475e-07

Rcv

0.211604728218

Rse

0.0

Rst

-0.202118119027

Rsv

17938283.5508


Height range @ 1km [m]

5

Height range @ 2km [m]

5

Height range @ 5km [m]

24

Height range @ 10km [m]

-999

Height range @ 20km [m]

-999


Variance slope @ 1 km

25

Variance slope @ 2 km

15

Variance slope @ 5 km

6

Variance slope @ 10 km

-999

Variance slope @ 20 km

-999


NDVI (max. NDVI composite)


Roman et al. (2009) index


St

2.15079898173e-07

Rcv

0.39527205362

Rse

0.0

Rst

0.166272427082

Rsv

13948304.3497


NDVI range @ 1km [-]

0.03

NDVI range @ 2km [-]

0.06

NDVI range @ 5km [-]

0.12

NDVI range @ 10km [-]

0.12

NDVI range @ 20km [-]

0.13


Variance slope @ 1 km

0.000239744059038

Variance slope @ 2 km

0.000287467187474

Variance slope @ 5 km

0.000245639286213

Variance slope @ 10 km

0.000123377795966

Variance slope @ 20 km

5.43317596937e-05


NDVI (min. NDVI composite)I


Roman et al. (2009) index


St

5.7313865713

Rcv

0.157286031704

Rse

0.0

Rst

-0.0521782086094

Rsv

0.313969306295


NDVI range @ 1km [-]

0.02

NDVI range @ 2km [-]

0.04

NDVI range @ 5km [-]

0.06

NDVI range @ 10km [-]

0.07

NDVI range @ 20km [-]

0.09


NDVI slope @ 1 km

9.43610387328e-05

NDVI slope @ 2 km

0.000110561792259

NDVI slope @ 5 km

9.42986354887e-05

NDVI slope @ 10 km

5.21063971421e-05

NDVI slope @ 20 km

2.53353795173e-05


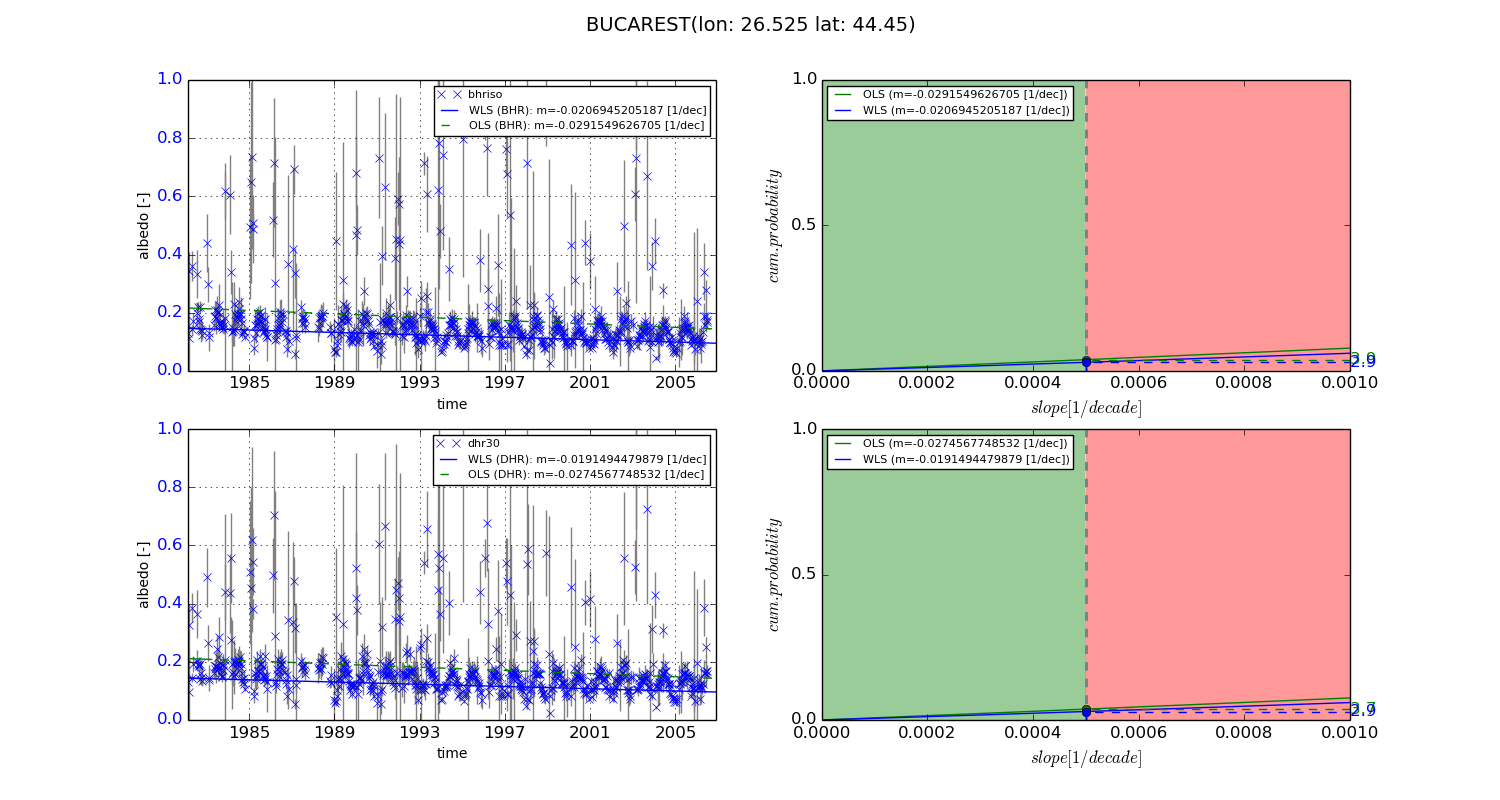
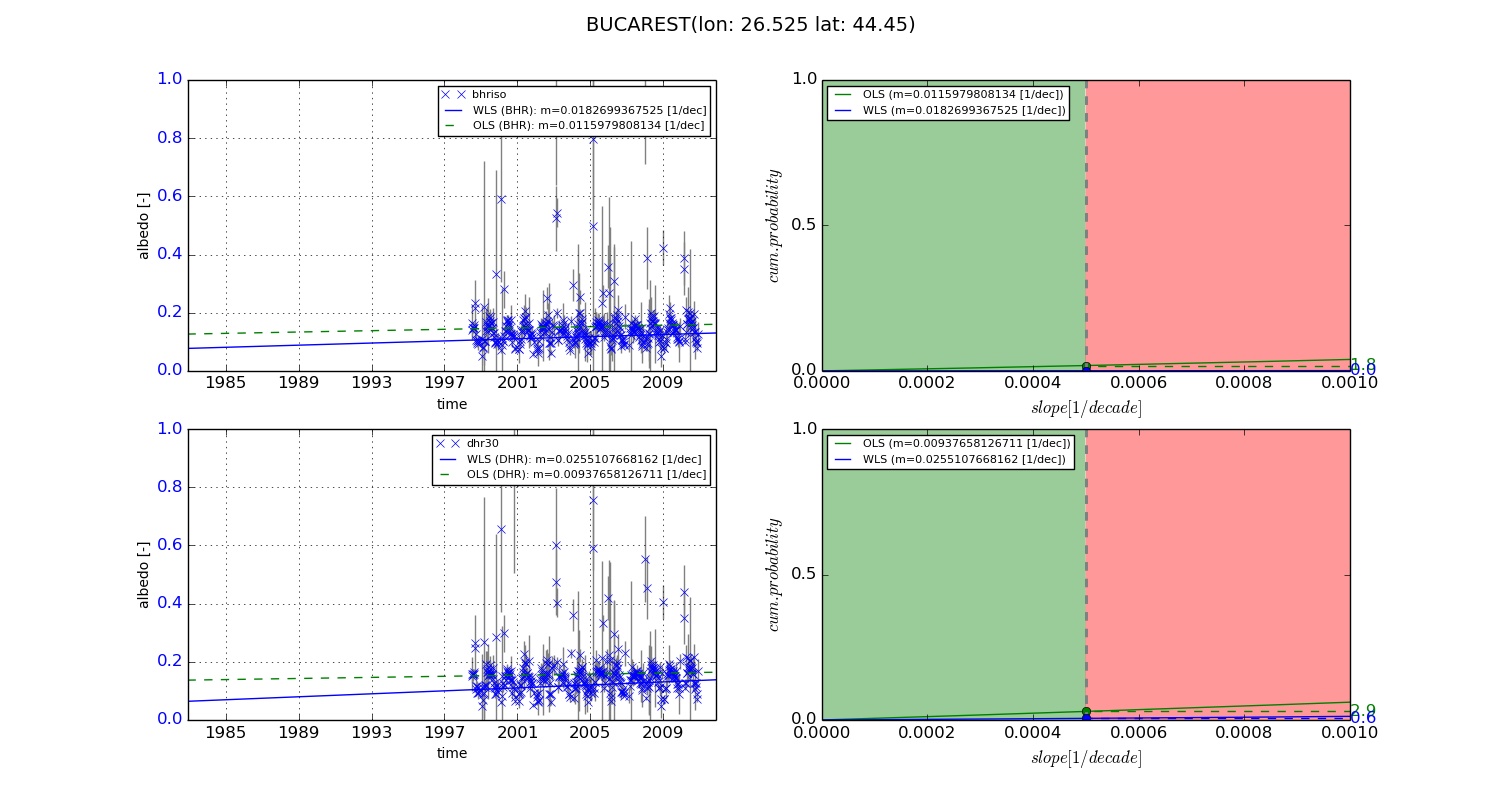
Temporal stability analysis

+000 deg (BHR)


BHR statistics

Temporal stability [1/decade]:


abs

rel


Weighted least square:

-0.0206945205187


Ordinary least square:

-0.0291549626705


Probabilities that GCOS criteria is met:

Weighted least square:

2.9 %

Ordinary least square:

3.9 %


DHR statistics

Temporal stability [1/decade]:


abs

rel


Weighted least square:

-0.0191494479879


Ordinary least square:

-0.0274567748532


Probabilities that GCOS criteria is met:

Weighted least square:

2.9 %

Ordinary least square:

3.7 %


+057/+063 deg (BHR)


BHR statistics

Temporal stability [1/decade]:


abs

rel


Weighted least square:

0.0182699367525


Ordinary least square:

0.0115979808134


Probabilities that GCOS criteria is met:

Weighted least square:

0.0 %

Ordinary least square:

1.8 %


DHR statistics

Temporal stability [1/decade]:


abs

rel


Weighted least square:

0.0255107668162


Ordinary least square:

0.00937658126711


Probabilities that GCOS criteria is met:

Weighted least square:

0.6 %

Ordinary least square:

2.9 %


Temporal anomaly analyis

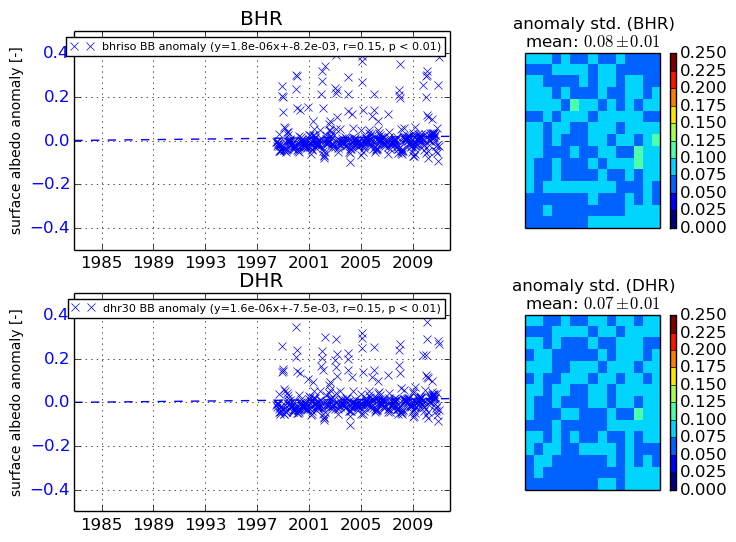
The variance of the temporal anomalies provides an additional measure about the stability of the signal AFTER removal of the mean seasonal cylce.
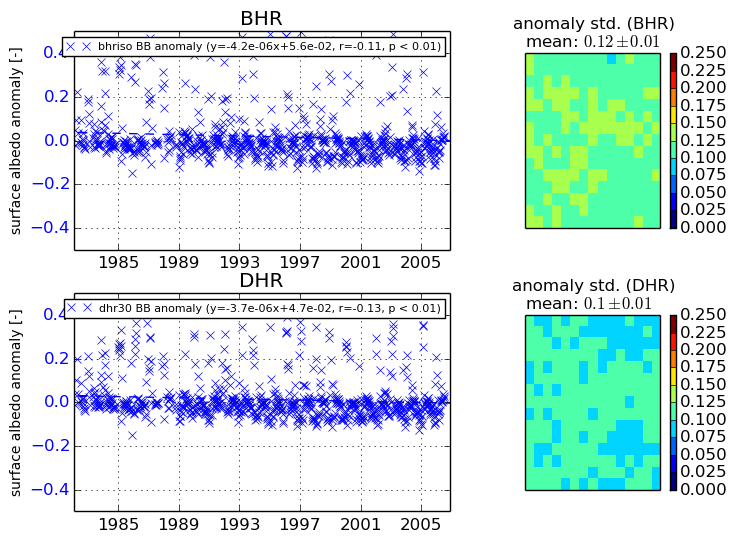
+000 deg


+057/+063 deg