BUCHAREST_INOE


Location

lon / lat [deg]: 26.0297 / 44.3481

Source network: AERONET


Geostationary surface albedo (GSA) data


“+000”


“+057/+063”


Landcover information (based on ESA CCI landcover data)


Landcover fractions @ 2km distance


Landcover fractions @ 20 km distance


Legend


Distance to open water bodies [km]:

4.68

Distance to urban areas [km]:

0.08


Radius: 1 km

Number of landcover classes:

3

Dominant landcover type:

190: urban areas

Fraction of dominant landcover type [%]:

54.0


Radius: 2 km

Number of landcover classes:

5

Dominant landcover type:

10: cropland, rainfed

Fraction of dominant landcover type [%]:

62.0


Radius: 5 km

Number of landcover classes:

3

Dominant landcover type:

10: cropland, rainfed

Fraction of dominant landcover type [%]:

65.0


Radius: 10 km

Number of landcover classes:

4

Dominant landcover type:

10: cropland, rainfed

Fraction of dominant landcover type [%]:

50.0


Radius: 20 km

Number of landcover classes:

5

Dominant landcover type:

10: cropland, rainfed

Fraction of dominant landcover type [%]:

57.0


Disturbances


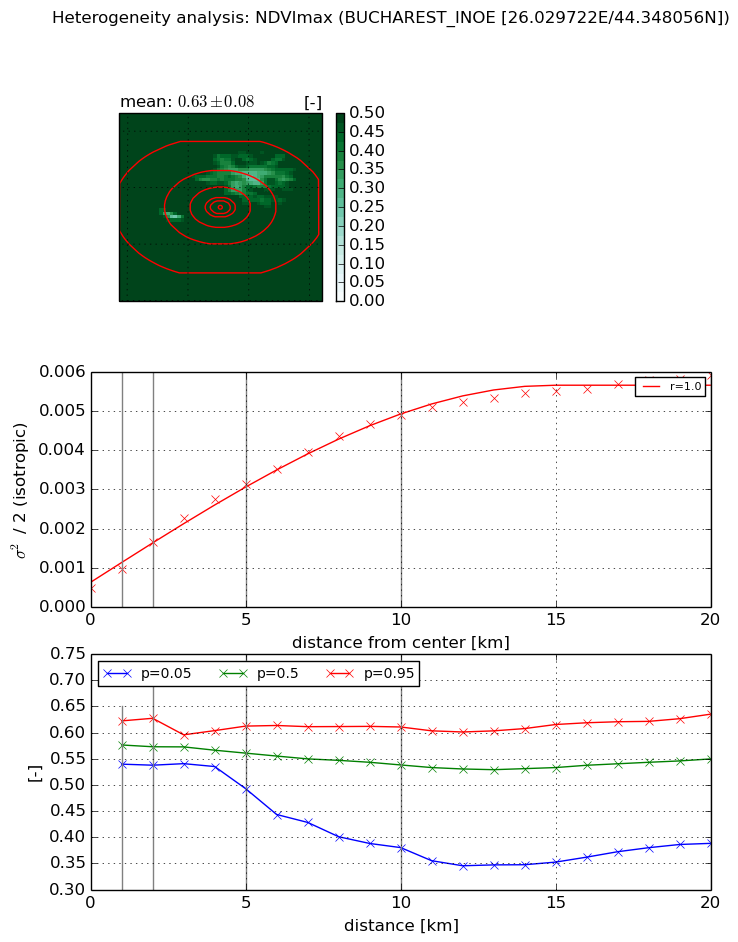
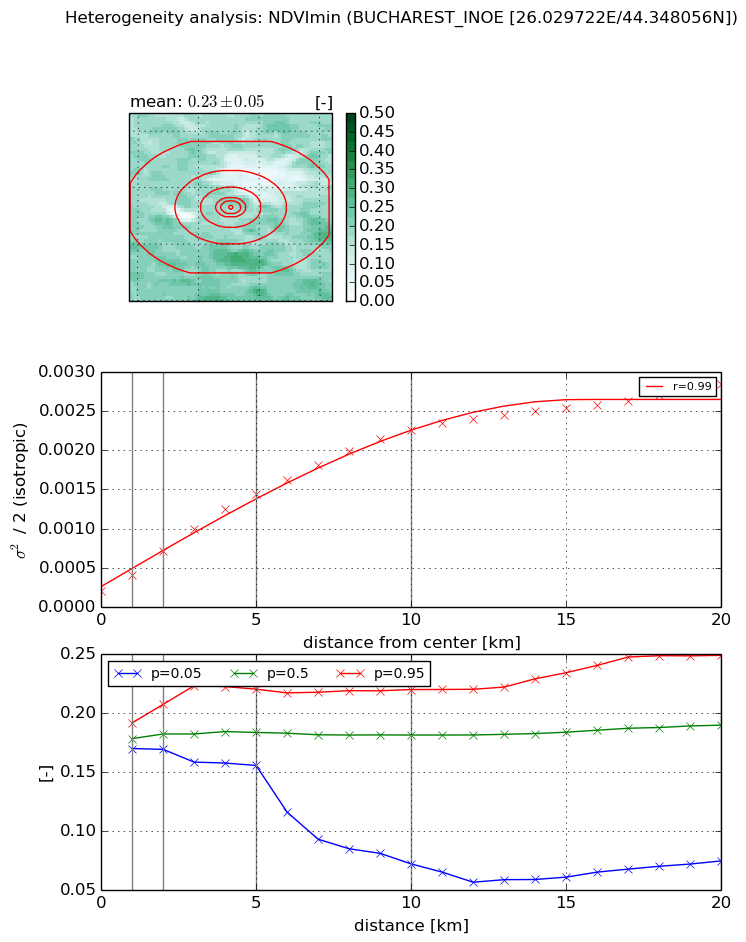
Heterogeneity analysis

The heterogeneity analysis provides information about the spatial and temporal heterogeneity of the site.

Topography


Roman et al. (2009) index


St

2.655168608

Rcv

0.036598131231

Rse

0.0

Rst

-0.0932737031858

Rsv

-0.999999914955


Height range @ 1km [m]

13

Height range @ 2km [m]

15

Height range @ 5km [m]

17

Height range @ 10km [m]

-999

Height range @ 20km [m]

-999


Variance slope @ 1 km

5

Variance slope @ 2 km

4

Variance slope @ 5 km

6

Variance slope @ 10 km

-999

Variance slope @ 20 km

-999


NDVI (max. NDVI composite)


Roman et al. (2009) index


St

1.28345652036

Rcv

0.671679517247

Rse

0.0

Rst

-0.665759196768

Rsv

-0.999999253232


NDVI range @ 1km [-]

0.08

NDVI range @ 2km [-]

0.09

NDVI range @ 5km [-]

0.12

NDVI range @ 10km [-]

0.23

NDVI range @ 20km [-]

0.25


Variance slope @ 1 km

0.000497737377127

Variance slope @ 2 km

0.0005908061529

Variance slope @ 5 km

0.000549196395759

Variance slope @ 10 km

0.000445177435889

Variance slope @ 20 km

0.000256734907167


NDVI (min. NDVI composite)I


Roman et al. (2009) index


St

nan

Rcv

nan

Rse

nan

Rst

nan

Rsv

nan


NDVI range @ 1km [-]

0.02

NDVI range @ 2km [-]

0.04

NDVI range @ 5km [-]

0.06

NDVI range @ 10km [-]

0.15

NDVI range @ 20km [-]

0.17


NDVI slope @ 1 km

0.000207240705487

NDVI slope @ 2 km

0.000255451490852

NDVI slope @ 5 km

0.000257520064644

NDVI slope @ 10 km

0.000209683839707

NDVI slope @ 20 km

0.000123360198881


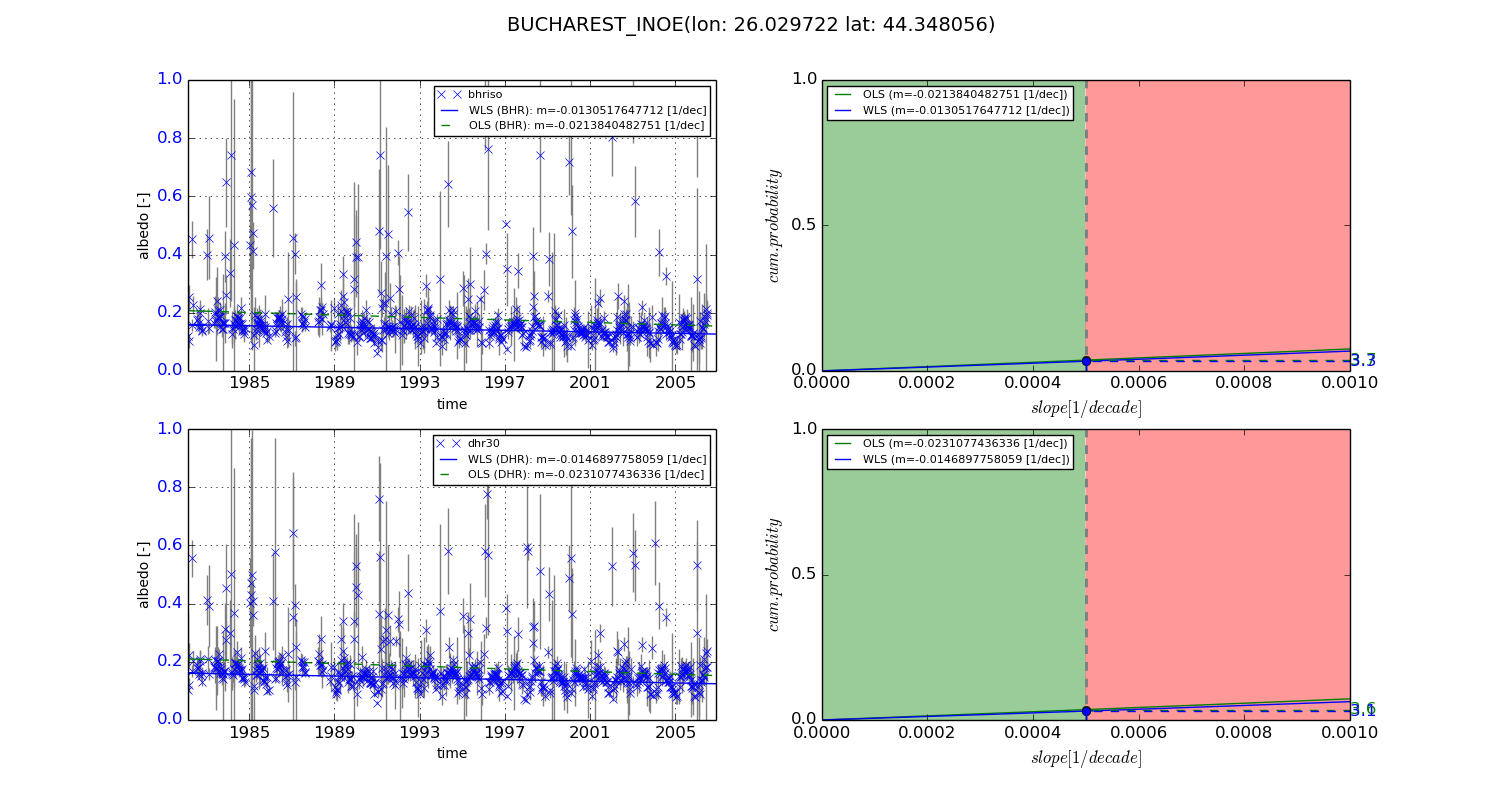
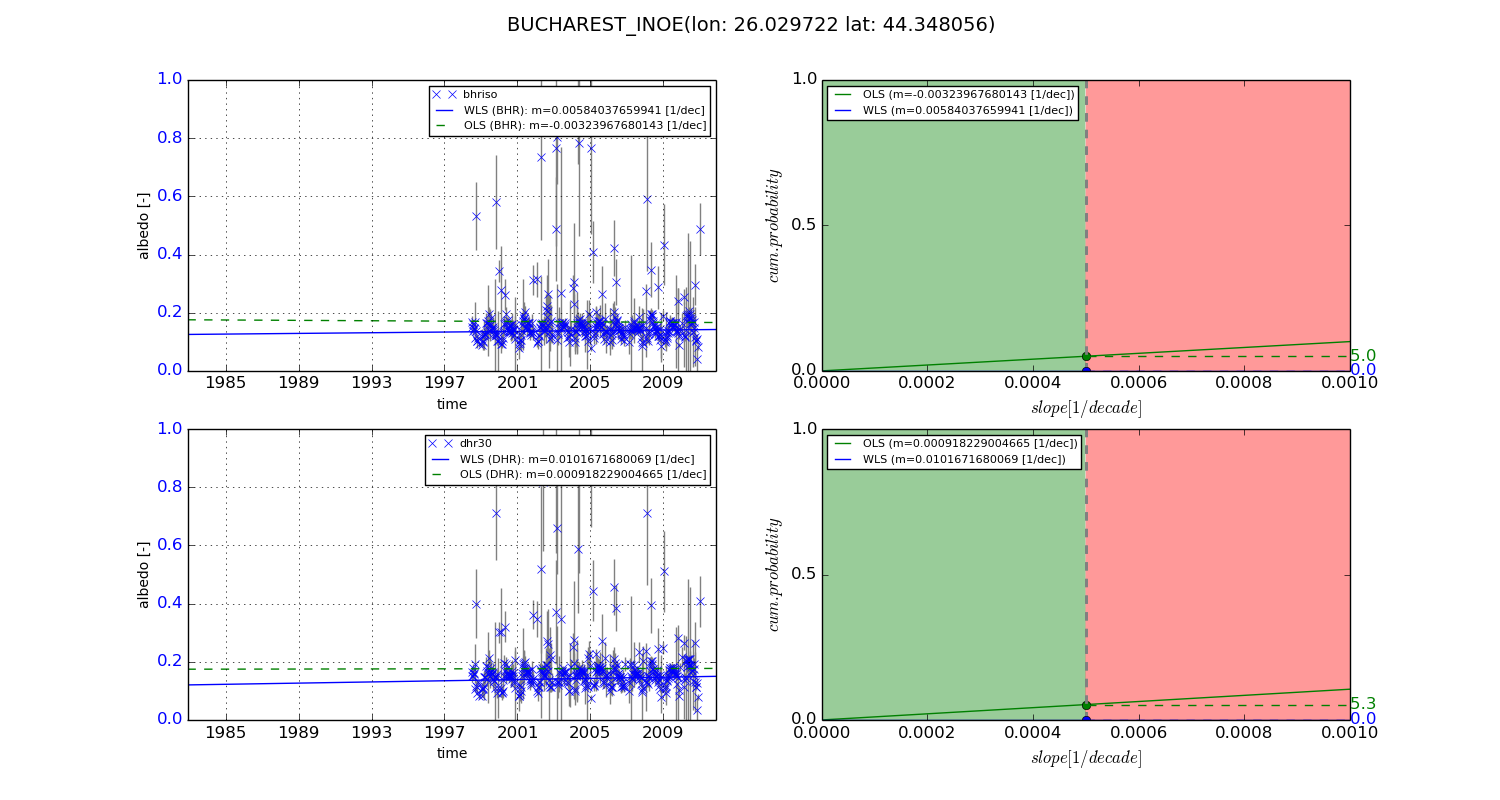
Temporal stability analysis

+000 deg (BHR)


BHR statistics

Temporal stability [1/decade]:


abs

rel


Weighted least square:

-0.0130517647712


Ordinary least square:

-0.0213840482751


Probabilities that GCOS criteria is met:

Weighted least square:

3.3 %

Ordinary least square:

3.7 %


DHR statistics

Temporal stability [1/decade]:


abs

rel


Weighted least square:

-0.0146897758059


Ordinary least square:

-0.0231077436336


Probabilities that GCOS criteria is met:

Weighted least square:

3.1 %

Ordinary least square:

3.6 %


+057/+063 deg (BHR)


BHR statistics

Temporal stability [1/decade]:


abs

rel


Weighted least square:

0.00584037659941


Ordinary least square:

-0.00323967680143


Probabilities that GCOS criteria is met:

Weighted least square:

0.0 %

Ordinary least square:

5.0 %


DHR statistics

Temporal stability [1/decade]:


abs

rel


Weighted least square:

0.0101671680069


Ordinary least square:

0.000918229004665


Probabilities that GCOS criteria is met:

Weighted least square:

0.0 %

Ordinary least square:

5.3 %


Temporal anomaly analyis

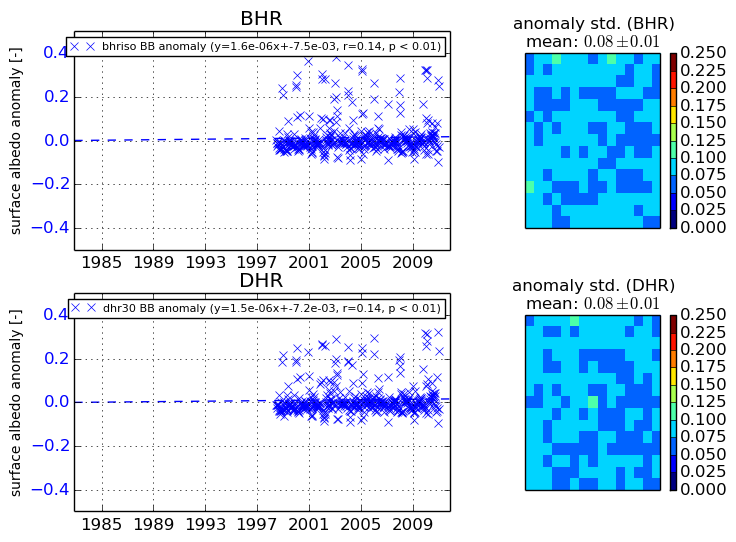
The variance of the temporal anomalies provides an additional measure about the stability of the signal AFTER removal of the mean seasonal cylce.
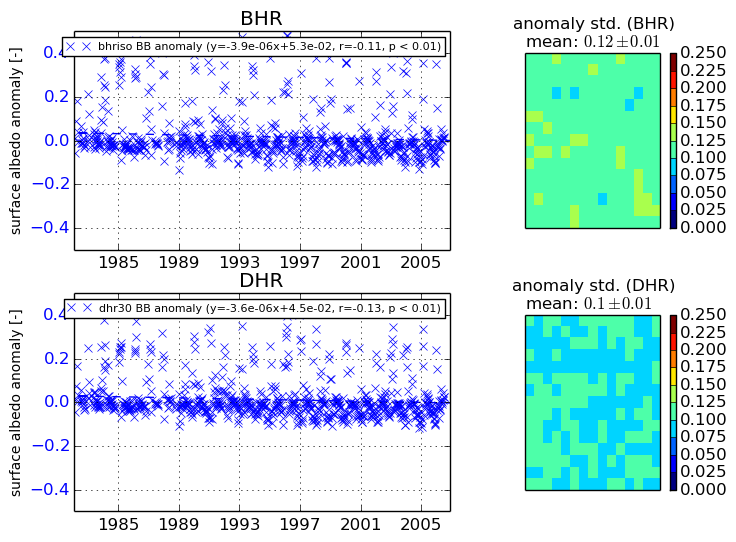
+000 deg


+057/+063 deg