BUD


Location

lon / lat [deg]: 19.1823 / 47.429

Source network: BSRN


Geostationary surface albedo (GSA) data


“+000”


“+057/+063”


Landcover information (based on ESA CCI landcover data)


Landcover fractions @ 2km distance


Landcover fractions @ 20 km distance


Legend


Distance to open water bodies [km]:

6.84

Distance to urban areas [km]:

0.03


Radius: 1 km

Number of landcover classes:

1

Dominant landcover type:

190: urban areas

Fraction of dominant landcover type [%]:

100.0


Radius: 2 km

Number of landcover classes:

2

Dominant landcover type:

190: urban areas

Fraction of dominant landcover type [%]:

97.0


Radius: 5 km

Number of landcover classes:

3

Dominant landcover type:

190: urban areas

Fraction of dominant landcover type [%]:

88.0


Radius: 10 km

Number of landcover classes:

4

Dominant landcover type:

190: urban areas

Fraction of dominant landcover type [%]:

76.0


Radius: 20 km

Number of landcover classes:

4

Dominant landcover type:

190: urban areas

Fraction of dominant landcover type [%]:

53.0


Disturbances


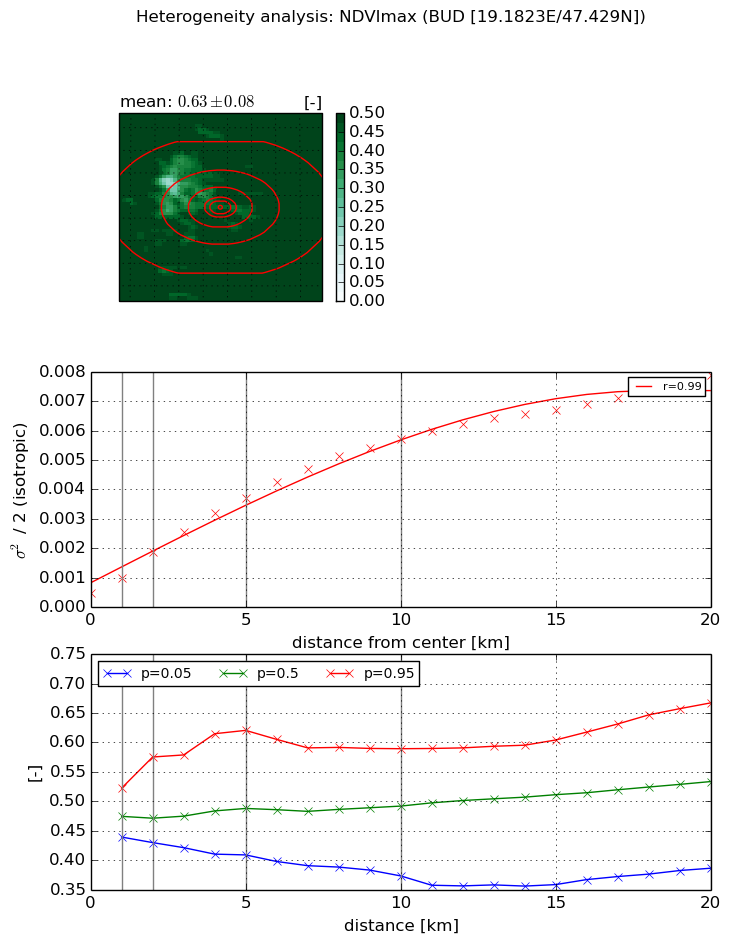
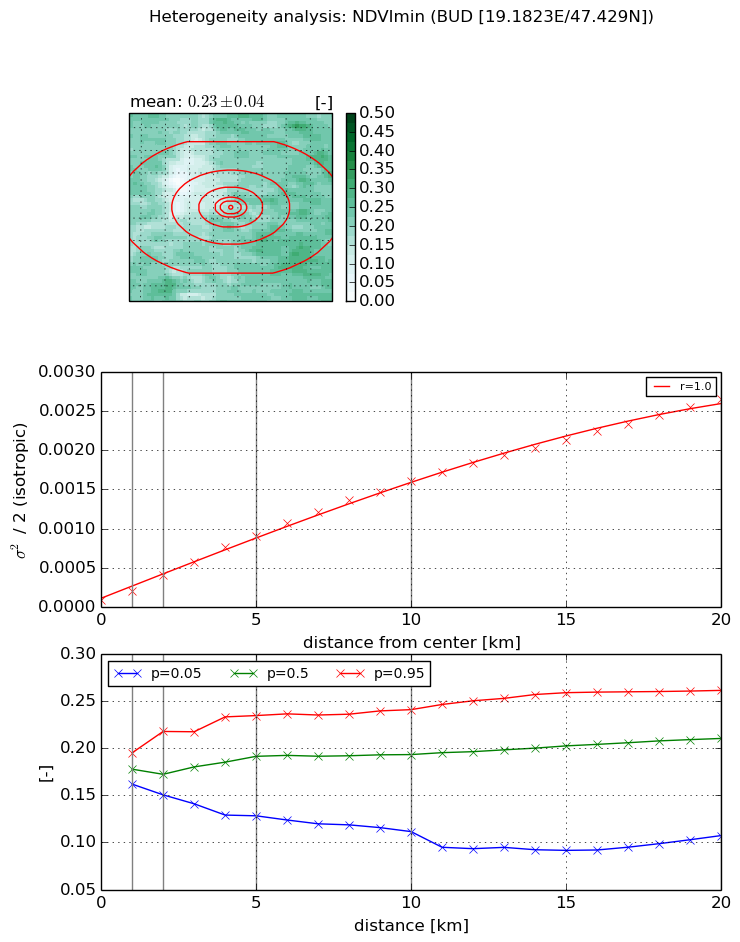
Heterogeneity analysis

The heterogeneity analysis provides information about the spatial and temporal heterogeneity of the site.

Topography


Roman et al. (2009) index


St

4.03524834094

Rcv

0.26717396723

Rse

0.0

Rst

8.44542365861e-06

Rsv

0.476266254324


Height range @ 1km [m]

20

Height range @ 2km [m]

24

Height range @ 5km [m]

35

Height range @ 10km [m]

-999

Height range @ 20km [m]

-999


Variance slope @ 1 km

15

Variance slope @ 2 km

16

Variance slope @ 5 km

26

Variance slope @ 10 km

-999

Variance slope @ 20 km

-999


NDVI (max. NDVI composite)


Roman et al. (2009) index


St

2.30629843474

Rcv

0.308692167203

Rse

0.0

Rst

0.808142095711

Rsv

-0.183951426746


NDVI range @ 1km [-]

0.08

NDVI range @ 2km [-]

0.15

NDVI range @ 5km [-]

0.21

NDVI range @ 10km [-]

0.22

NDVI range @ 20km [-]

0.28


Variance slope @ 1 km

0.000541507485102

Variance slope @ 2 km

0.000708309572848

Variance slope @ 5 km

0.000669571465992

Variance slope @ 10 km

0.000536602988677

Variance slope @ 20 km

0.000343323895712


NDVI (min. NDVI composite)I


Roman et al. (2009) index


St

2.50770706842

Rcv

0.334177385327

Rse

0.0

Rst

0.087791005

Rsv

0.774343586371


NDVI range @ 1km [-]

0.03

NDVI range @ 2km [-]

0.07

NDVI range @ 5km [-]

0.11

NDVI range @ 10km [-]

0.13

NDVI range @ 20km [-]

0.15


NDVI slope @ 1 km

0.000114287781829

NDVI slope @ 2 km

0.000159273772936

NDVI slope @ 5 km

0.000169235059628

NDVI slope @ 10 km

0.00015576767398

NDVI slope @ 20 km

0.00012682105447


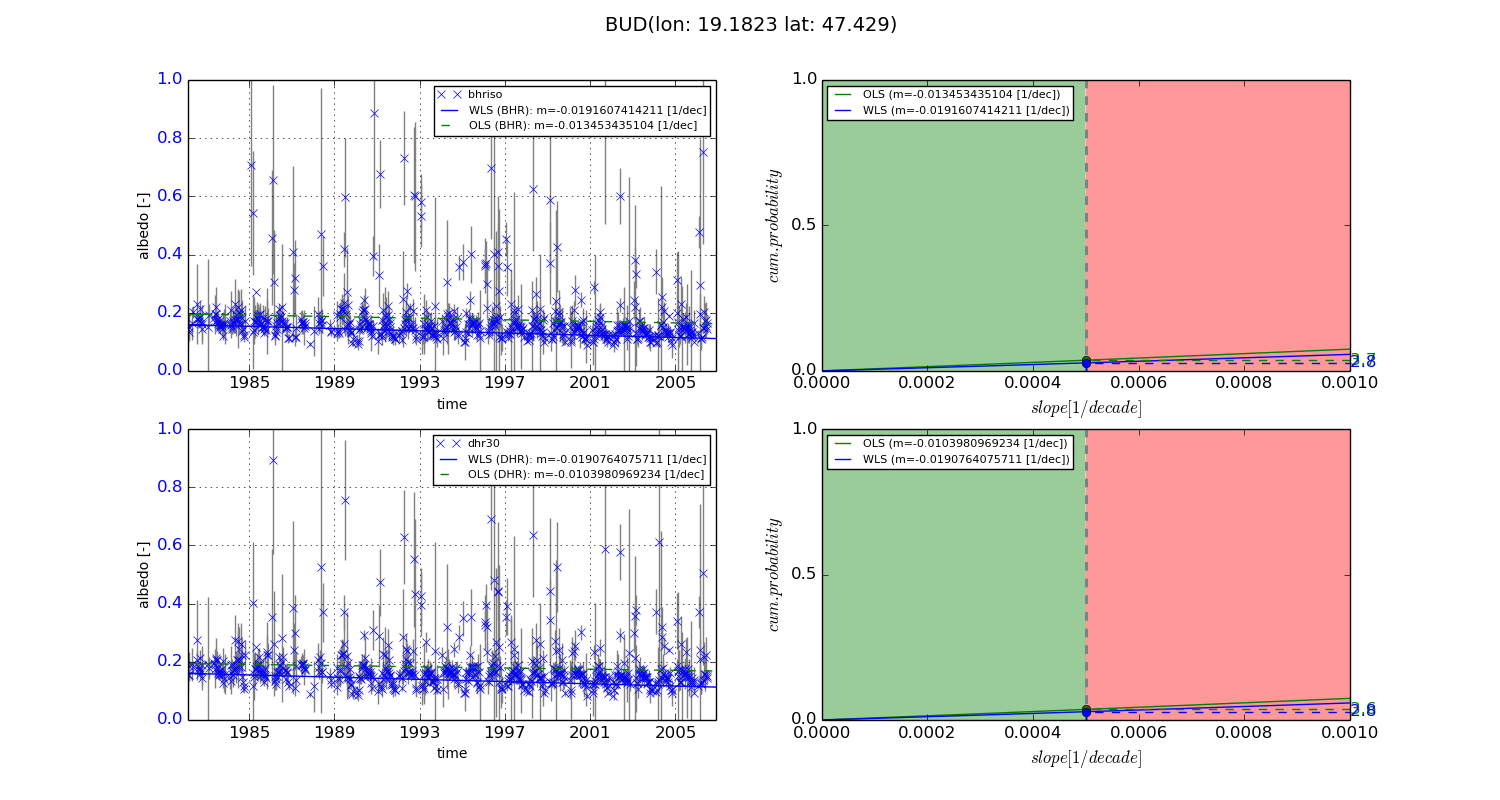
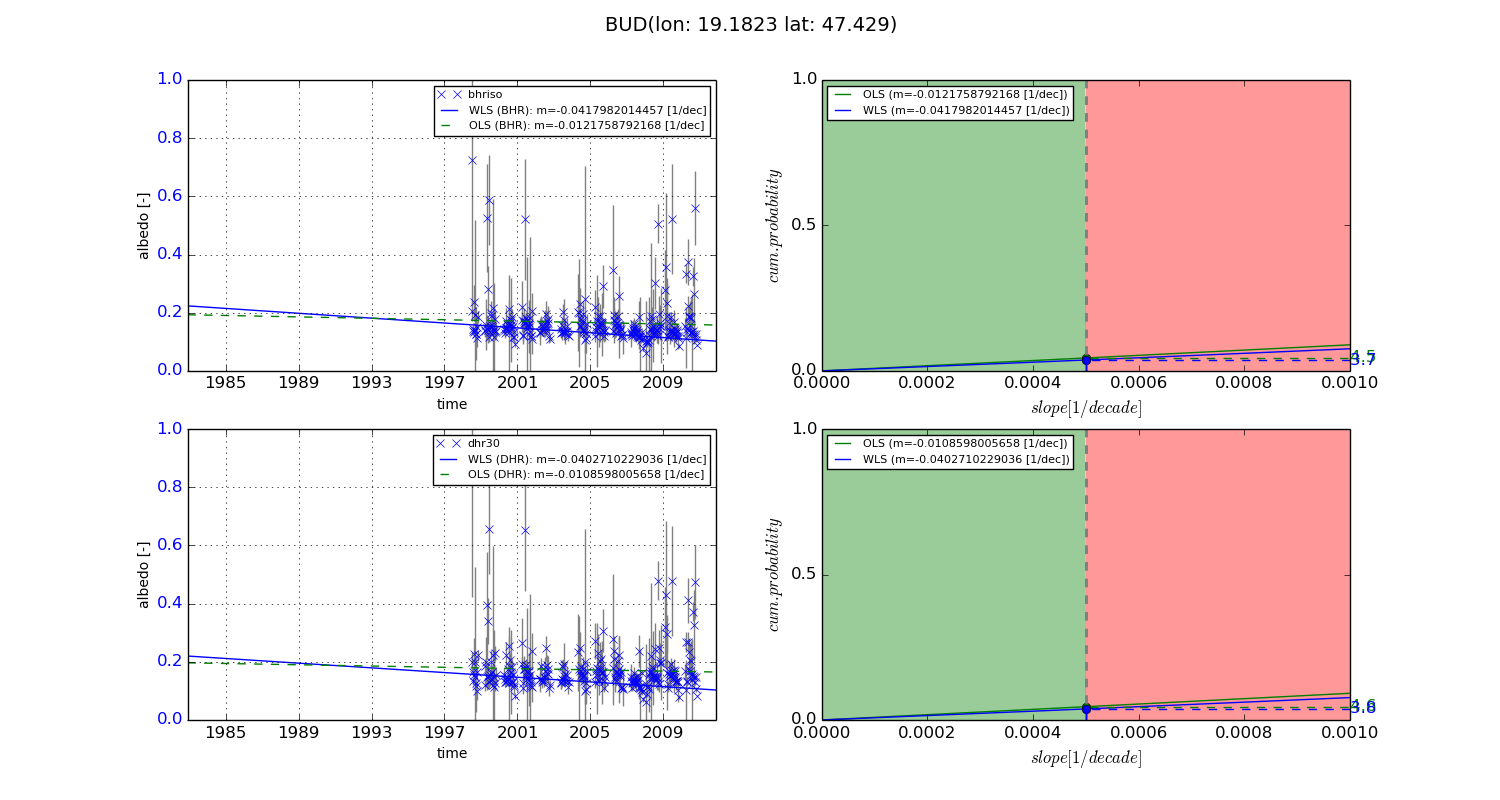
Temporal stability analysis

+000 deg (BHR)


BHR statistics

Temporal stability [1/decade]:


abs

rel


Weighted least square:

-0.0191607414211


Ordinary least square:

-0.013453435104


Probabilities that GCOS criteria is met:

Weighted least square:

2.8 %

Ordinary least square:

3.7 %


DHR statistics

Temporal stability [1/decade]:


abs

rel


Weighted least square:

-0.0190764075711


Ordinary least square:

-0.0103980969234


Probabilities that GCOS criteria is met:

Weighted least square:

2.8 %

Ordinary least square:

3.6 %


+057/+063 deg (BHR)


BHR statistics

Temporal stability [1/decade]:


abs

rel


Weighted least square:

-0.0417982014457


Ordinary least square:

-0.0121758792168


Probabilities that GCOS criteria is met:

Weighted least square:

3.7 %

Ordinary least square:

4.5 %


DHR statistics

Temporal stability [1/decade]:


abs

rel


Weighted least square:

-0.0402710229036


Ordinary least square:

-0.0108598005658


Probabilities that GCOS criteria is met:

Weighted least square:

3.8 %

Ordinary least square:

4.6 %


Temporal anomaly analyis

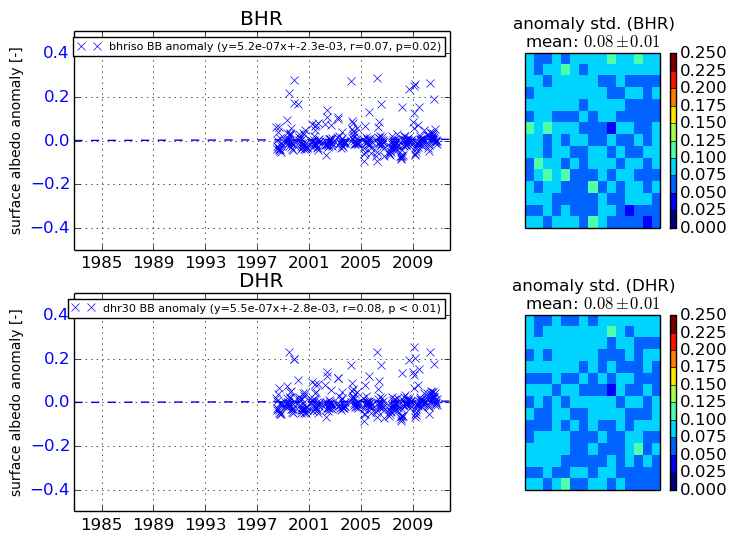
The variance of the temporal anomalies provides an additional measure about the stability of the signal AFTER removal of the mean seasonal cylce.
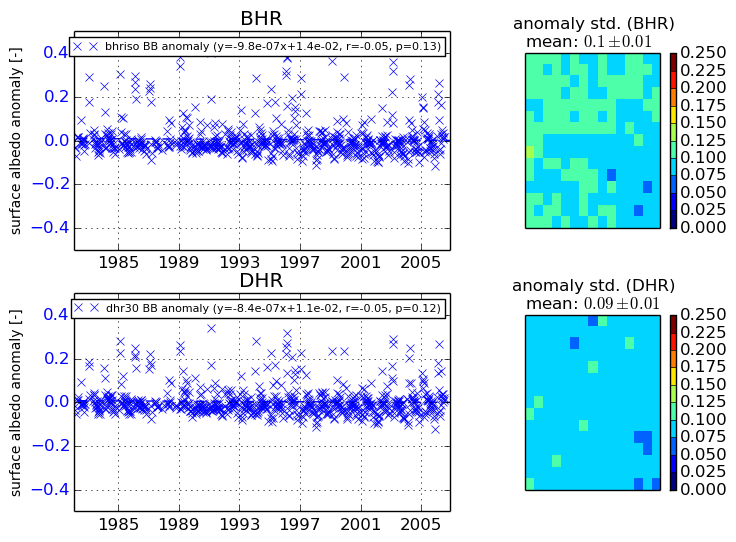
+000 deg


+057/+063 deg