BUENA_VISTA


Location

lon / lat [deg]: -119.26 / 35.22

Source network: AERONET


Geostationary surface albedo (GSA) data


“+000”


“+057/+063”


Landcover information (based on ESA CCI landcover data)


Landcover fractions @ 2km distance


Landcover fractions @ 20 km distance


Legend


Distance to open water bodies [km]:

0.1

Distance to urban areas [km]:

2.4


Radius: 1 km

Number of landcover classes:

3

Dominant landcover type:

210: water bodies

Fraction of dominant landcover type [%]:

51.0


Radius: 2 km

Number of landcover classes:

5

Dominant landcover type:

10: cropland, rainfed

Fraction of dominant landcover type [%]:

47.0


Radius: 5 km

Number of landcover classes:

5

Dominant landcover type:

10: cropland, rainfed

Fraction of dominant landcover type [%]:

64.0


Radius: 10 km

Number of landcover classes:

5

Dominant landcover type:

10: cropland, rainfed

Fraction of dominant landcover type [%]:

49.0


Radius: 20 km

Number of landcover classes:

4

Dominant landcover type:

120: Shrubland

Fraction of dominant landcover type [%]:

47.0


Disturbances


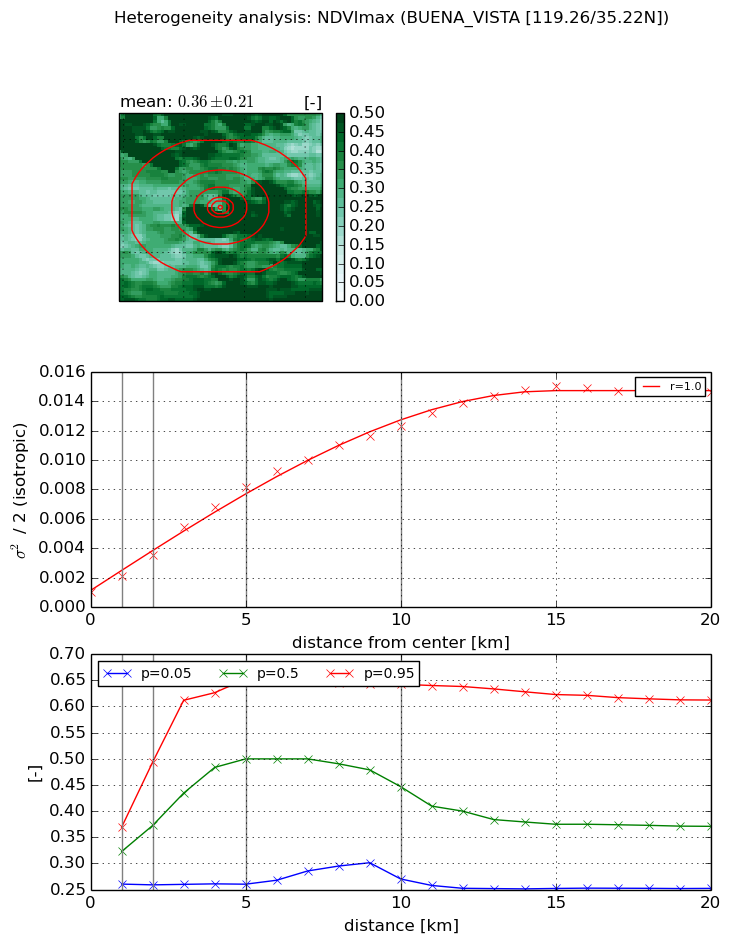
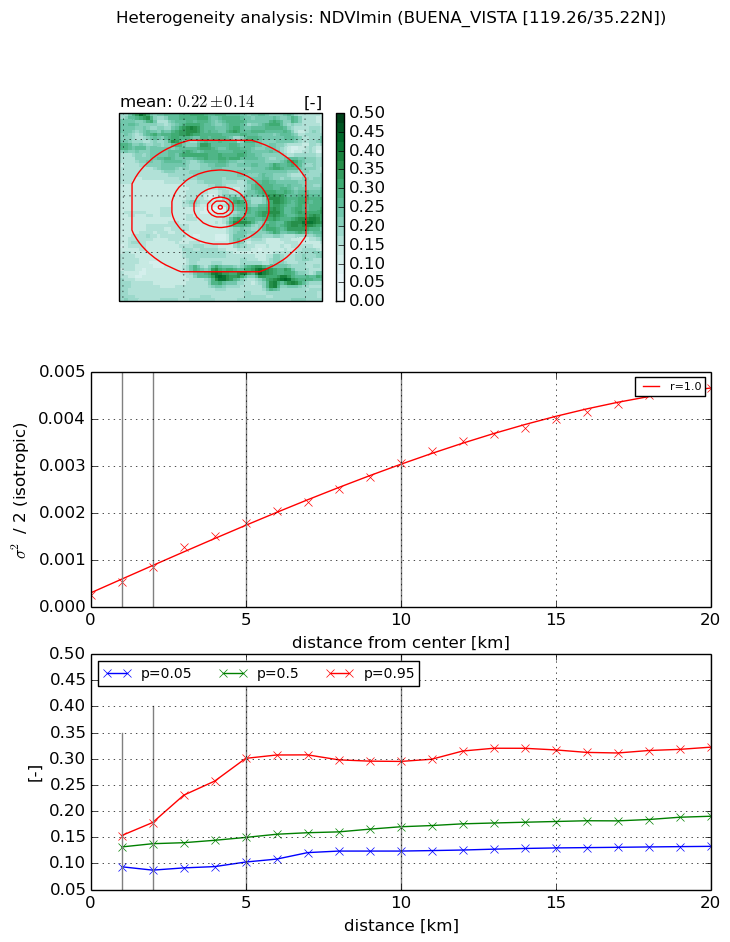
Heterogeneity analysis

The heterogeneity analysis provides information about the spatial and temporal heterogeneity of the site.

Topography


Roman et al. (2009) index


St

2.75844410367

Rcv

0.0264399670807

Rse

0.0

Rst

0.0611307196032

Rsv

-0.99999893128


Height range @ 1km [m]

10

Height range @ 2km [m]

8

Height range @ 5km [m]

8

Height range @ 10km [m]

-999

Height range @ 20km [m]

-999


Variance slope @ 1 km

4

Variance slope @ 2 km

3

Variance slope @ 5 km

1

Variance slope @ 10 km

-999

Variance slope @ 20 km

-999


NDVI (max. NDVI composite)


Roman et al. (2009) index


St

3.0780349736

Rcv

-0.0225926568671

Rse

0.0

Rst

-0.149679810879

Rsv

0.80237532727


NDVI range @ 1km [-]

0.11

NDVI range @ 2km [-]

0.23

NDVI range @ 5km [-]

0.39

NDVI range @ 10km [-]

0.37

NDVI range @ 20km [-]

0.36


Variance slope @ 1 km

0.00110407118903

Variance slope @ 2 km

0.00126624445864

Variance slope @ 5 km

0.00147338882418

Variance slope @ 10 km

0.00116935017718

Variance slope @ 20 km

0.000685024658811


NDVI (min. NDVI composite)I


Roman et al. (2009) index


St

1.90393805039

Rcv

0.254017954968

Rse

0.0

Rst

-5.41165681449e-09

Rsv

1.32166355897


NDVI range @ 1km [-]

0.06

NDVI range @ 2km [-]

0.09

NDVI range @ 5km [-]

0.2

NDVI range @ 10km [-]

0.17

NDVI range @ 20km [-]

0.19


NDVI slope @ 1 km

0.000274215291864

NDVI slope @ 2 km

0.000304707441239

NDVI slope @ 5 km

0.000316947211943

NDVI slope @ 10 km

0.000276810598898

NDVI slope @ 20 km

0.000223983648146


Temporal stability analysis

+000 deg (BHR)


BHR statistics

Temporal stability [1/decade]:


abs

rel


Weighted least square:

None


Ordinary least square:

None


Probabilities that GCOS criteria is met:

Weighted least square:

None %

Ordinary least square:

None %


DHR statistics

Temporal stability [1/decade]:


abs

rel


Weighted least square:

None


Ordinary least square:

None


Probabilities that GCOS criteria is met:

Weighted least square:

None %

Ordinary least square:

None %


+057/+063 deg (BHR)


BHR statistics

Temporal stability [1/decade]:


abs

rel


Weighted least square:

None


Ordinary least square:

None


Probabilities that GCOS criteria is met:

Weighted least square:

None %

Ordinary least square:

None %


DHR statistics

Temporal stability [1/decade]:


abs

rel


Weighted least square:

None


Ordinary least square:

None


Probabilities that GCOS criteria is met:

Weighted least square:

None %

Ordinary least square:

None %


Temporal anomaly analyis

The variance of the temporal anomalies provides an additional measure about the stability of the signal AFTER removal of the mean seasonal cylce.

+000 deg


+057/+063 deg