BUJUMBURA


Location

lon / lat [deg]: 29.3838 / -3.38

Source network: AERONET


Geostationary surface albedo (GSA) data


“+000”


“+057/+063”


Landcover information (based on ESA CCI landcover data)


Landcover fractions @ 2km distance


Landcover fractions @ 20 km distance


Legend


Distance to open water bodies [km]:

3.92

Distance to urban areas [km]:

0.14


Radius: 1 km

Number of landcover classes:

2

Dominant landcover type:

190: urban areas

Fraction of dominant landcover type [%]:

97.0


Radius: 2 km

Number of landcover classes:

2

Dominant landcover type:

190: urban areas

Fraction of dominant landcover type [%]:

81.0


Radius: 5 km

Number of landcover classes:

4

Dominant landcover type:

190: urban areas

Fraction of dominant landcover type [%]:

50.0


Radius: 10 km

Number of landcover classes:

6

Dominant landcover type:

10: cropland, rainfed

Fraction of dominant landcover type [%]:

56.0


Radius: 20 km

Number of landcover classes:

5

Dominant landcover type:

10: cropland, rainfed

Fraction of dominant landcover type [%]:

65.0


Disturbances


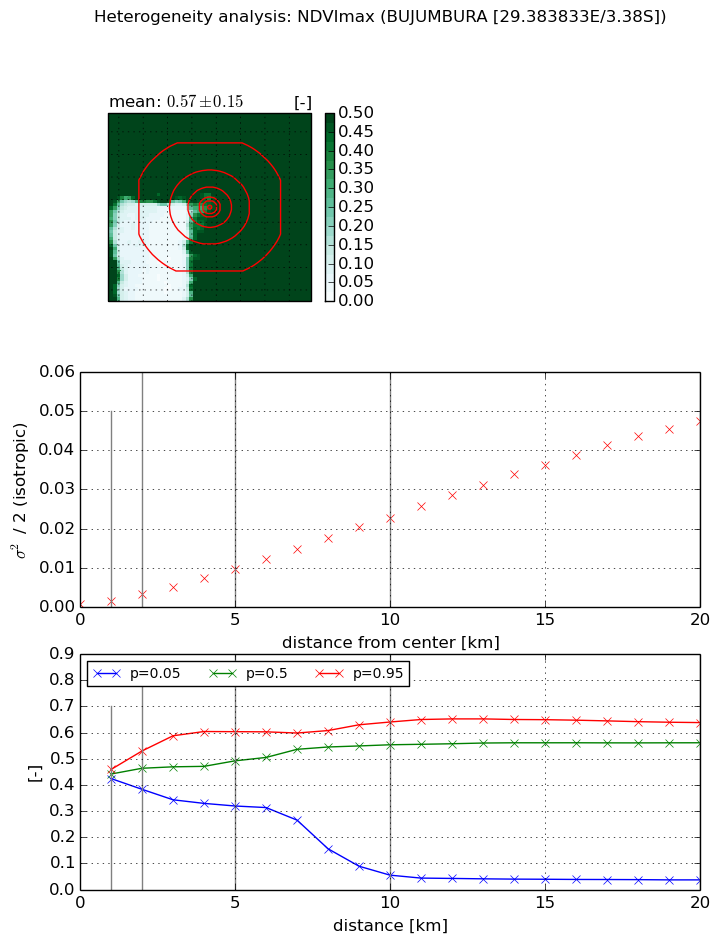
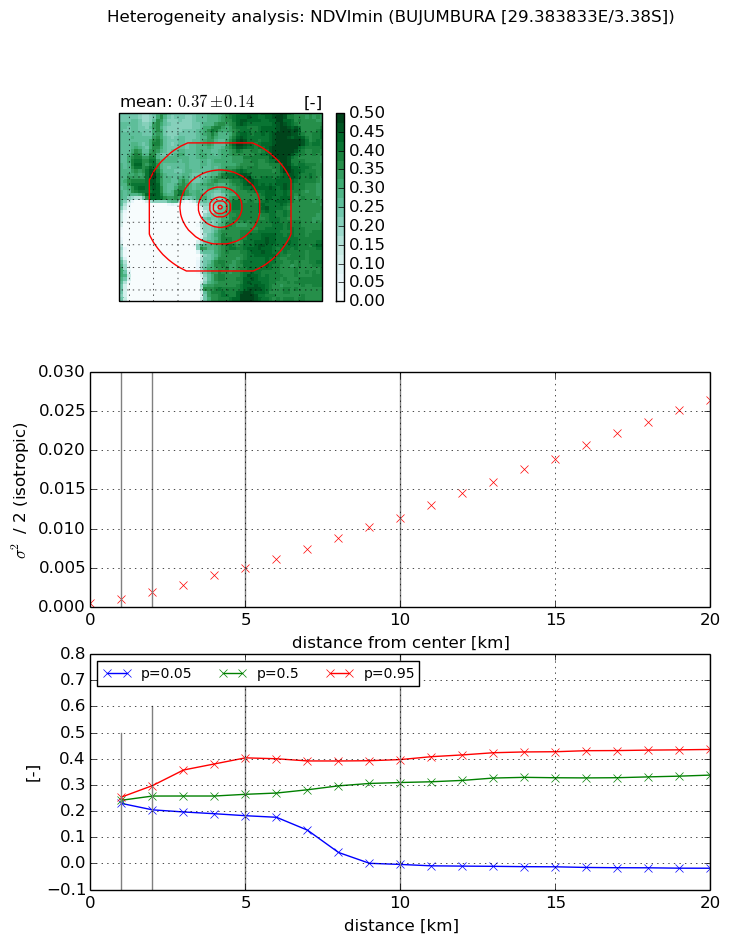
Heterogeneity analysis

The heterogeneity analysis provides information about the spatial and temporal heterogeneity of the site.

Topography


Roman et al. (2009) index


St

1.96238826145

Rcv

0.538326675915

Rse

0.0

Rst

-2.00237448171e-05

Rsv

-0.990402762886


Height range @ 1km [m]

106

Height range @ 2km [m]

204

Height range @ 5km [m]

519

Height range @ 10km [m]

-999

Height range @ 20km [m]

-999


Variance slope @ 1 km

3655

Variance slope @ 2 km

4536

Variance slope @ 5 km

6855

Variance slope @ 10 km

-999

Variance slope @ 20 km

-999


NDVI (max. NDVI composite)


Roman et al. (2009) index


St

1.40987923573e-07

Rcv

0.106494718052

Rse

0.0

Rst

0.129388577284

Rsv

21278417.9716


NDVI range @ 1km [-]

0.03

NDVI range @ 2km [-]

0.15

NDVI range @ 5km [-]

0.28

NDVI range @ 10km [-]

0.59

NDVI range @ 20km [-]

0.6


Variance slope @ 1 km

0.000826611470417

Variance slope @ 2 km

0.00123425673174

Variance slope @ 5 km

0.00182903708897

Variance slope @ 10 km

0.00229557652516

Variance slope @ 20 km

0.0024965759023


NDVI (min. NDVI composite)I


Roman et al. (2009) index


St

4.52650885801

Rcv

0.326758533457

Rse

0.0

Rst

-5.56772706809e-08

Rsv

-0.336003838624


NDVI range @ 1km [-]

0.02

NDVI range @ 2km [-]

0.09

NDVI range @ 5km [-]

0.22

NDVI range @ 10km [-]

0.4

NDVI range @ 20km [-]

0.45


NDVI slope @ 1 km

0.000478860812633

NDVI slope @ 2 km

0.000696306256422

NDVI slope @ 5 km

0.000938517542992

NDVI slope @ 10 km

0.00112031054215

NDVI slope @ 20 km

0.00135226530585


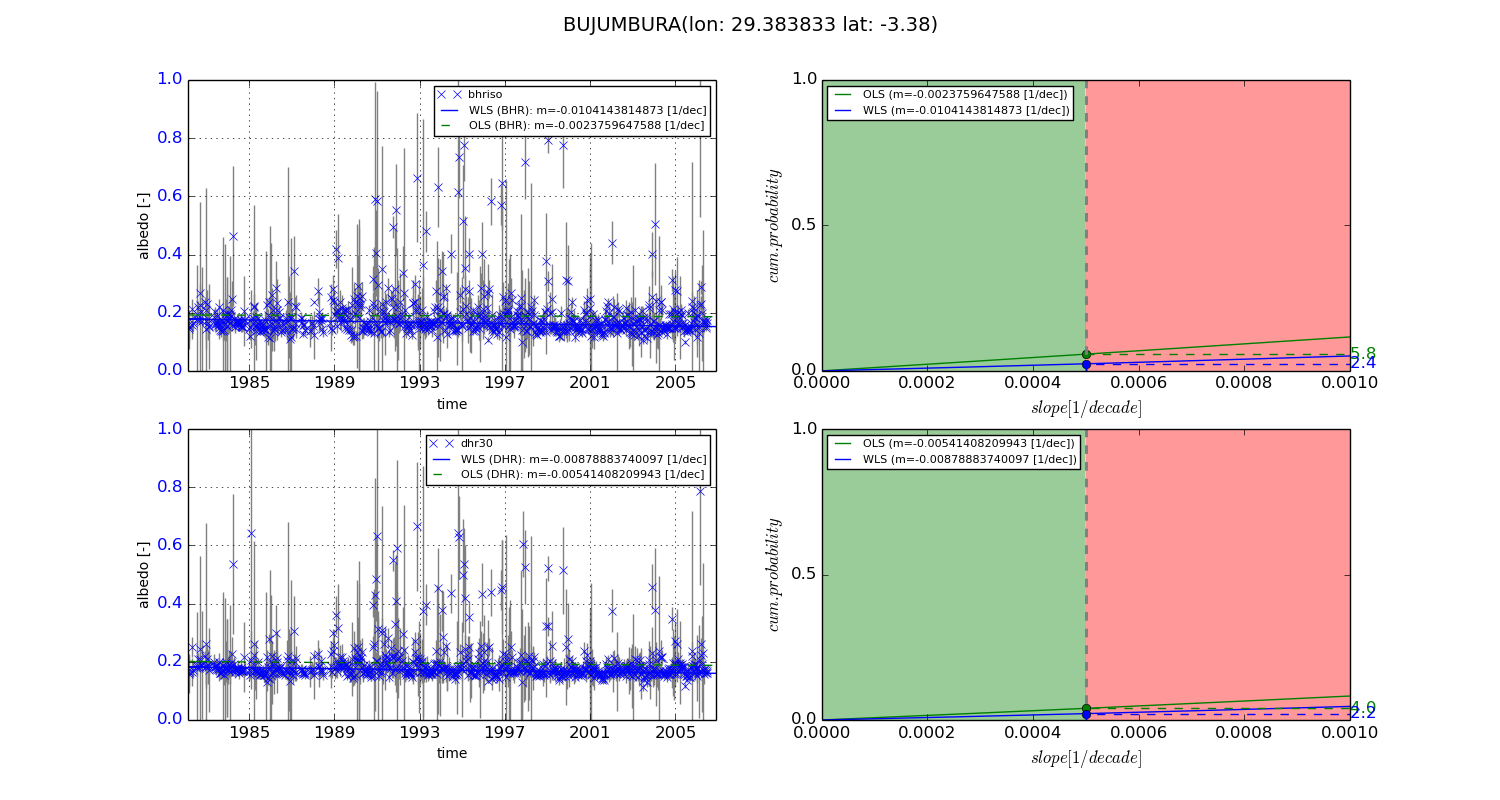
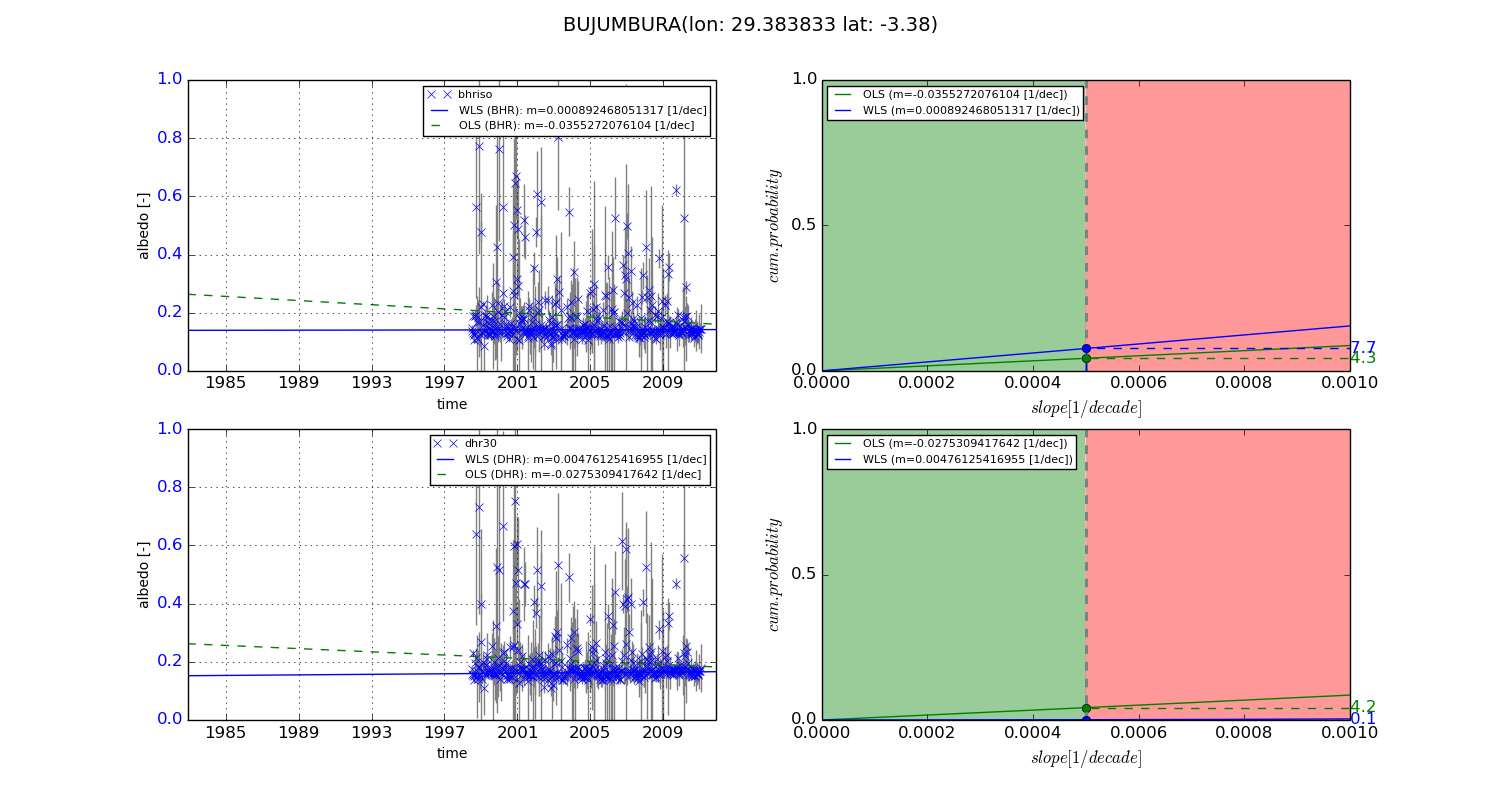
Temporal stability analysis

+000 deg (BHR)


BHR statistics

Temporal stability [1/decade]:


abs

rel


Weighted least square:

-0.0104143814873


Ordinary least square:

-0.0023759647588


Probabilities that GCOS criteria is met:

Weighted least square:

2.4 %

Ordinary least square:

5.8 %


DHR statistics

Temporal stability [1/decade]:


abs

rel


Weighted least square:

-0.00878883740097


Ordinary least square:

-0.00541408209943


Probabilities that GCOS criteria is met:

Weighted least square:

2.2 %

Ordinary least square:

4.0 %


+057/+063 deg (BHR)


BHR statistics

Temporal stability [1/decade]:


abs

rel


Weighted least square:

0.000892468051317


Ordinary least square:

-0.0355272076104


Probabilities that GCOS criteria is met:

Weighted least square:

7.7 %

Ordinary least square:

4.3 %


DHR statistics

Temporal stability [1/decade]:


abs

rel


Weighted least square:

0.00476125416955


Ordinary least square:

-0.0275309417642


Probabilities that GCOS criteria is met:

Weighted least square:

0.1 %

Ordinary least square:

4.2 %


Temporal anomaly analyis

The variance of the temporal anomalies provides an additional measure about the stability of the signal AFTER removal of the mean seasonal cylce.
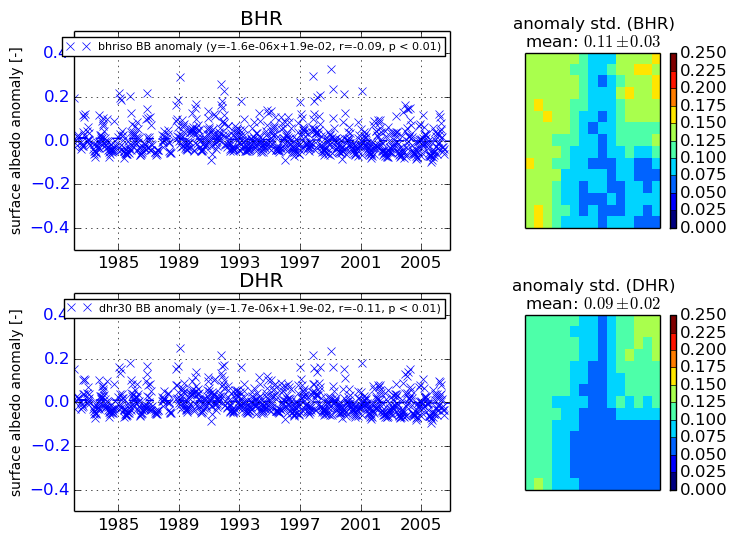
+000 deg


+057/+063 deg