BURE_OPE


Location

lon / lat [deg]: 5.505 / 48.5625

Source network: AERONET


Geostationary surface albedo (GSA) data


“+000”


“+057/+063”


Landcover information (based on ESA CCI landcover data)


Landcover fractions @ 2km distance


Landcover fractions @ 20 km distance


Legend


Distance to open water bodies [km]:

18.7

Distance to urban areas [km]:

3.14


Radius: 1 km

Number of landcover classes:

2

Dominant landcover type:

10: cropland, rainfed

Fraction of dominant landcover type [%]:

98.0


Radius: 2 km

Number of landcover classes:

5

Dominant landcover type:

10: cropland, rainfed

Fraction of dominant landcover type [%]:

85.0


Radius: 5 km

Number of landcover classes:

3

Dominant landcover type:

10: cropland, rainfed

Fraction of dominant landcover type [%]:

80.0


Radius: 10 km

Number of landcover classes:

4

Dominant landcover type:

10: cropland, rainfed

Fraction of dominant landcover type [%]:

59.0


Radius: 20 km

Number of landcover classes:

4

Dominant landcover type:

10: cropland, rainfed

Fraction of dominant landcover type [%]:

53.0


Disturbances


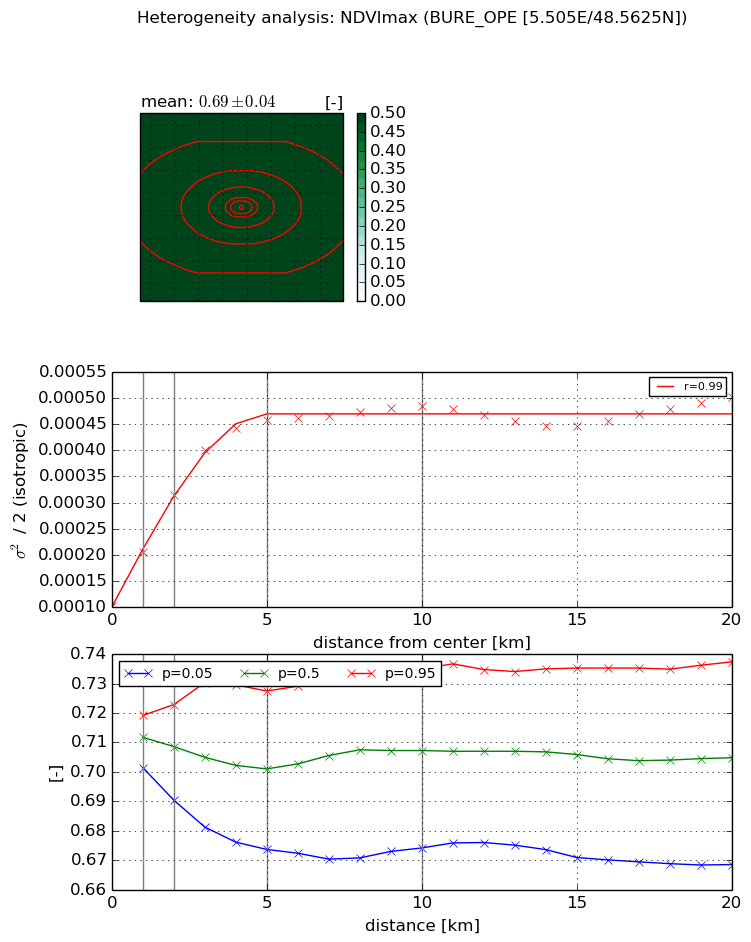
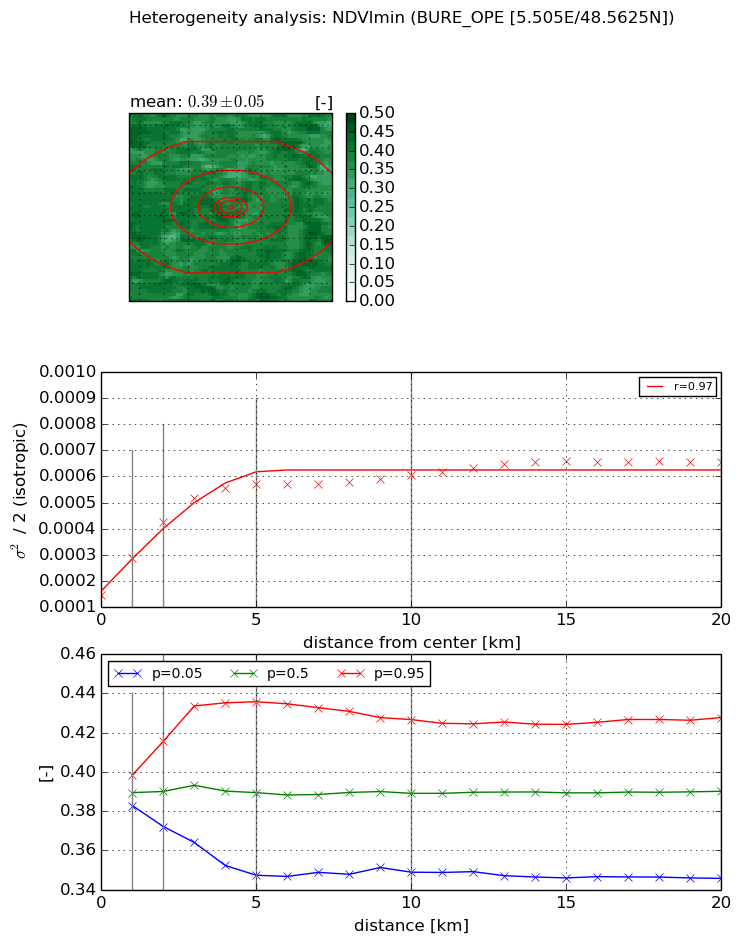
Heterogeneity analysis

The heterogeneity analysis provides information about the spatial and temporal heterogeneity of the site.

Topography


Roman et al. (2009) index


St

26.2164706191

Rcv

-0.0513959397297

Rse

0.0

Rst

-0.0420843408589

Rsv

0.0209515986519


Height range @ 1km [m]

68

Height range @ 2km [m]

90

Height range @ 5km [m]

105

Height range @ 10km [m]

-999

Height range @ 20km [m]

-999


Variance slope @ 1 km

456

Variance slope @ 2 km

400

Variance slope @ 5 km

255

Variance slope @ 10 km

-999

Variance slope @ 20 km

-999


NDVI (max. NDVI composite)


Roman et al. (2009) index


St

2.50606835334e-07

Rcv

0.0426333738451

Rse

0.0

Rst

0.232342284263

Rsv

11970942.1616


NDVI range @ 1km [-]

0.02

NDVI range @ 2km [-]

0.03

NDVI range @ 5km [-]

0.05

NDVI range @ 10km [-]

0.06

NDVI range @ 20km [-]

0.07


Variance slope @ 1 km

0.000104702855931

Variance slope @ 2 km

0.000107023237911

Variance slope @ 5 km

7.3647496627e-05

Variance slope @ 10 km

3.30114619343e-05

Variance slope @ 20 km

1.0768740698e-05


NDVI (min. NDVI composite)I


Roman et al. (2009) index


St

6.11257984039e-08

Rcv

0.338429628829

Rse

0.0

Rst

0.0359822127606

Rsv

49079113.1641


NDVI range @ 1km [-]

0.02

NDVI range @ 2km [-]

0.04

NDVI range @ 5km [-]

0.09

NDVI range @ 10km [-]

0.08

NDVI range @ 20km [-]

0.08


NDVI slope @ 1 km

0.00014455137644

NDVI slope @ 2 km

0.000140297472497

NDVI slope @ 5 km

8.62344644314e-05

NDVI slope @ 10 km

3.71877461583e-05

NDVI slope @ 20 km

1.68479666124e-05


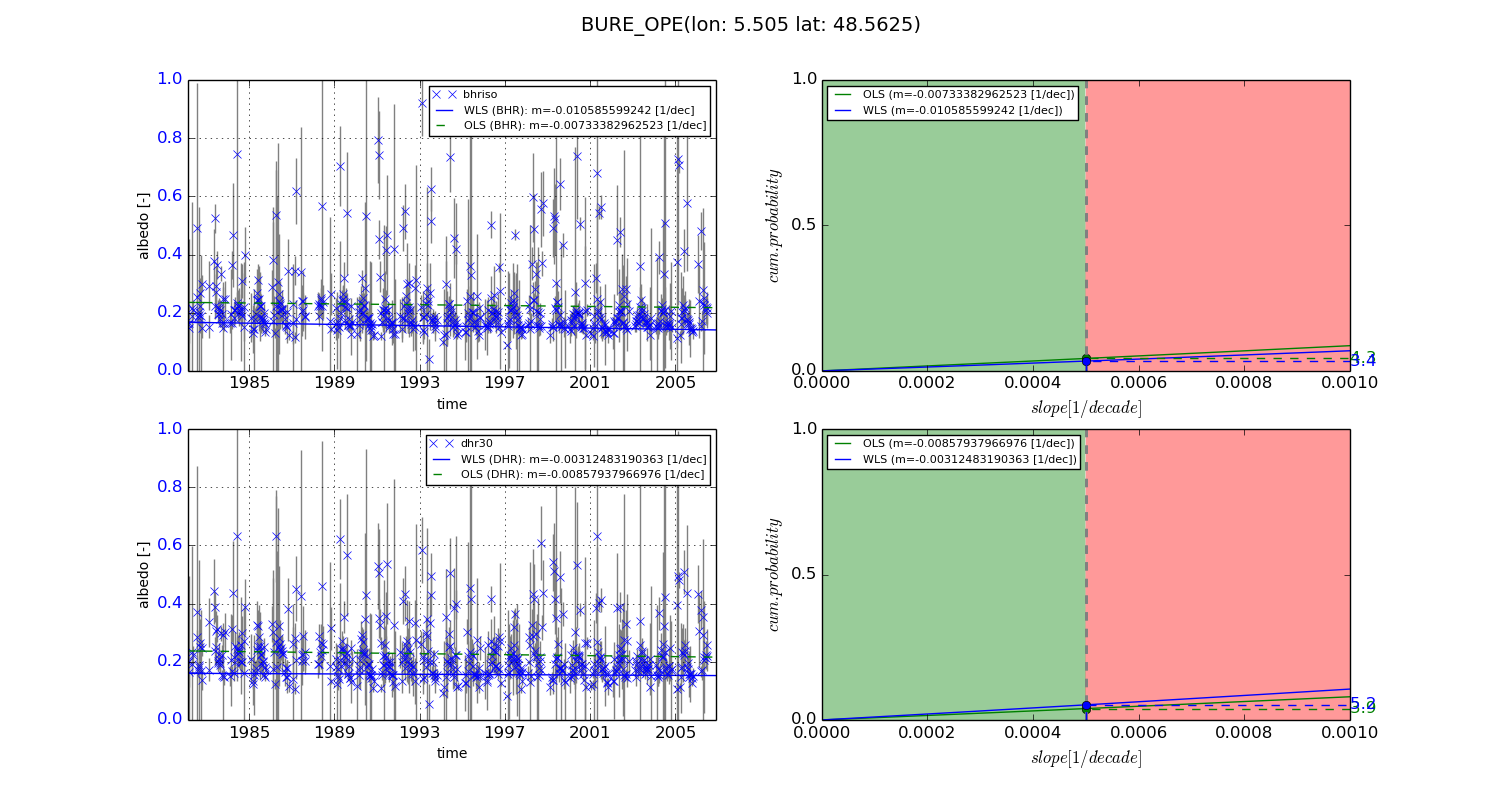
Temporal stability analysis

+000 deg (BHR)


BHR statistics

Temporal stability [1/decade]:


abs

rel


Weighted least square:

-0.010585599242


Ordinary least square:

-0.00733382962523


Probabilities that GCOS criteria is met:

Weighted least square:

3.4 %

Ordinary least square:

4.3 %


DHR statistics

Temporal stability [1/decade]:


abs

rel


Weighted least square:

-0.00312483190363


Ordinary least square:

-0.00857937966976


Probabilities that GCOS criteria is met:

Weighted least square:

5.2 %

Ordinary least square:

3.9 %


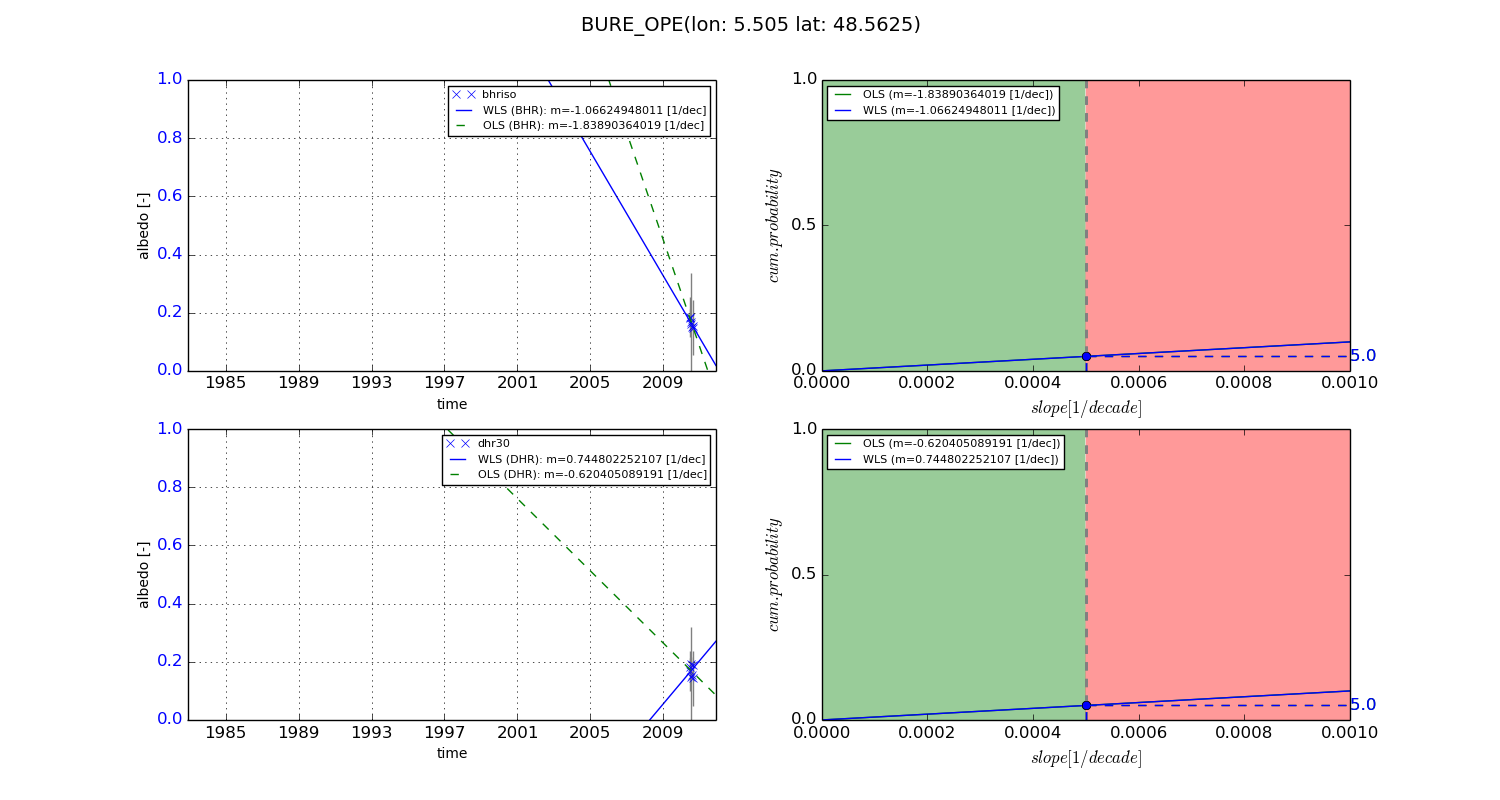
+057/+063 deg (BHR)


BHR statistics

Temporal stability [1/decade]:


abs

rel


Weighted least square:

-1.06624948011


Ordinary least square:

-1.83890364019


Probabilities that GCOS criteria is met:

Weighted least square:

5.0 %

Ordinary least square:

5.0 %


DHR statistics

Temporal stability [1/decade]:


abs

rel


Weighted least square:

0.744802252107


Ordinary least square:

-0.620405089191


Probabilities that GCOS criteria is met:

Weighted least square:

5.0 %

Ordinary least square:

5.0 %


Temporal anomaly analyis

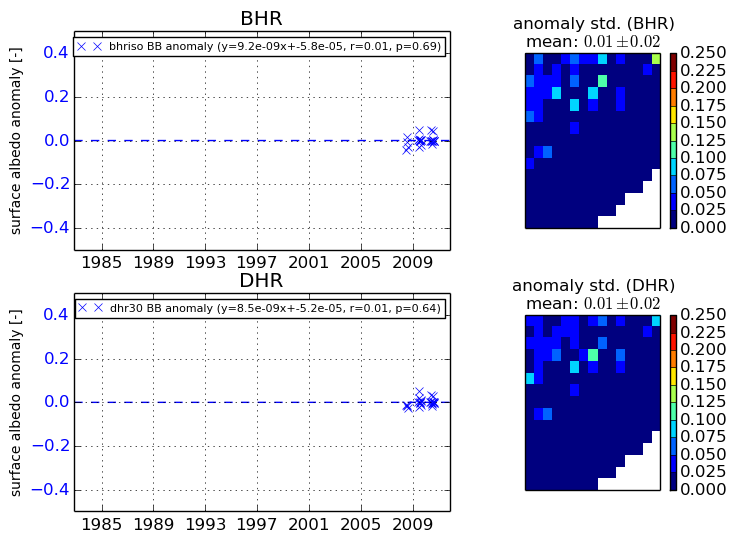
The variance of the temporal anomalies provides an additional measure about the stability of the signal AFTER removal of the mean seasonal cylce.
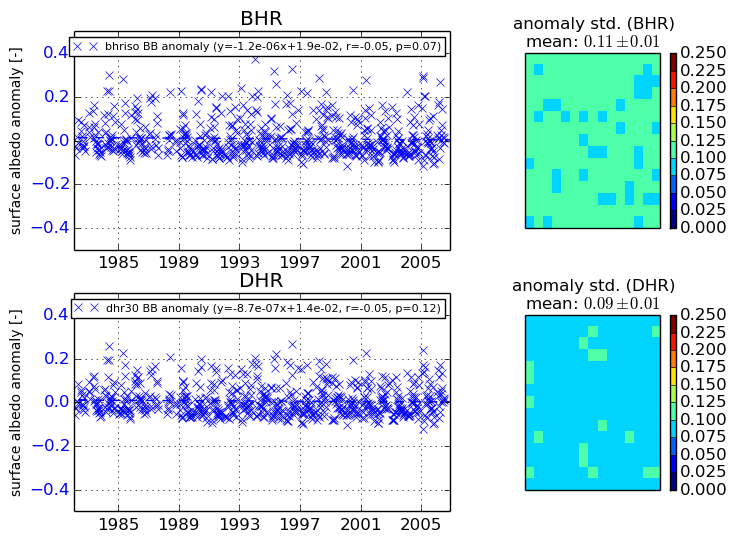
+000 deg


+057/+063 deg