BUSHLAND


Location

lon / lat [deg]: -102.0938 / 35.1868

Source network: AERONET


Geostationary surface albedo (GSA) data


“+000”


“+057/+063”


Landcover information (based on ESA CCI landcover data)


Landcover fractions @ 2km distance


Landcover fractions @ 20 km distance


Legend


Distance to open water bodies [km]:

5.39

Distance to urban areas [km]:

14.01


Radius: 1 km

Number of landcover classes:

1

Dominant landcover type:

130: grassland

Fraction of dominant landcover type [%]:

100.0


Radius: 2 km

Number of landcover classes:

3

Dominant landcover type:

130: grassland

Fraction of dominant landcover type [%]:

93.0


Radius: 5 km

Number of landcover classes:

2

Dominant landcover type:

130: grassland

Fraction of dominant landcover type [%]:

97.0


Radius: 10 km

Number of landcover classes:

2

Dominant landcover type:

130: grassland

Fraction of dominant landcover type [%]:

95.0


Radius: 20 km

Number of landcover classes:

3

Dominant landcover type:

130: grassland

Fraction of dominant landcover type [%]:

91.0


Disturbances


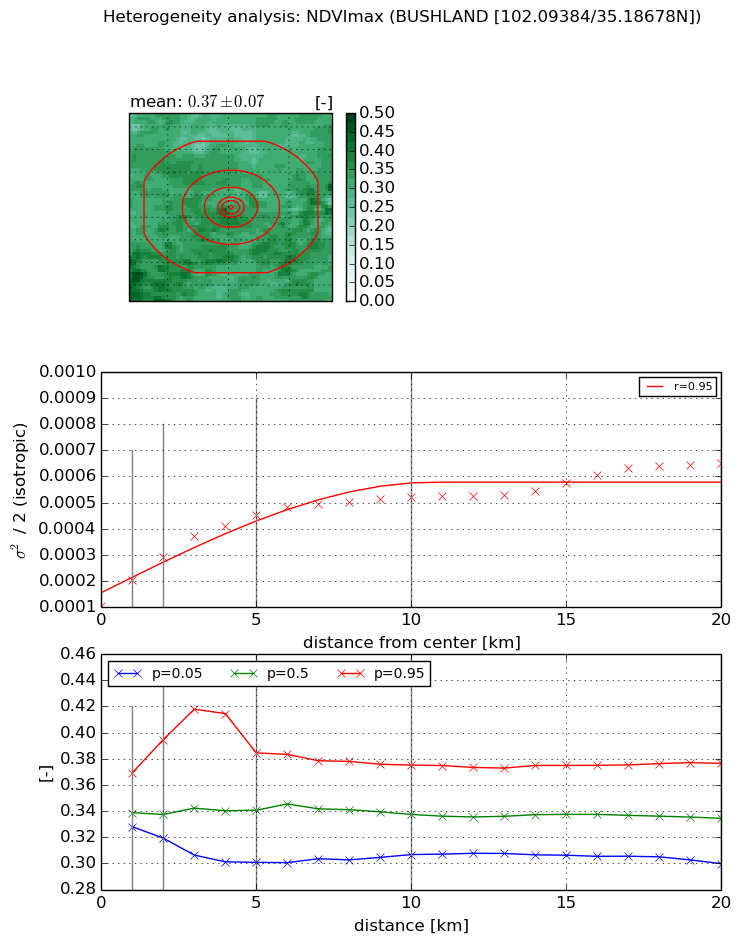
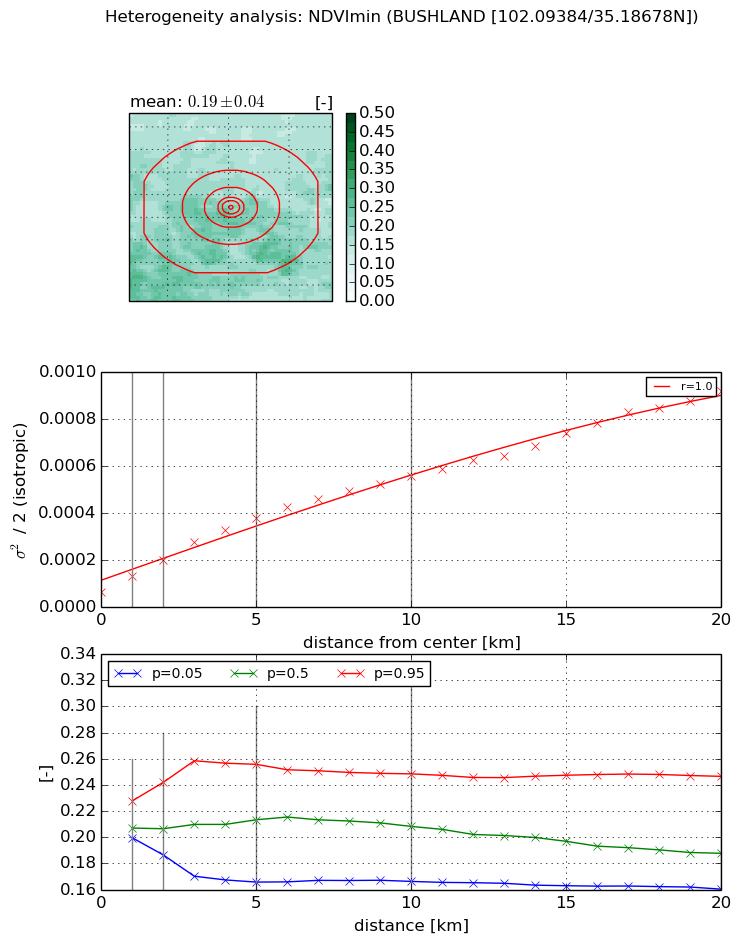
Heterogeneity analysis

The heterogeneity analysis provides information about the spatial and temporal heterogeneity of the site.

Topography


Roman et al. (2009) index


St

2.28814066523

Rcv

0.73554541586

Rse

0.0

Rst

0.106938387131

Rsv

0.468624401845


Height range @ 1km [m]

14

Height range @ 2km [m]

19

Height range @ 5km [m]

36

Height range @ 10km [m]

-999

Height range @ 20km [m]

-999


Variance slope @ 1 km

40

Variance slope @ 2 km

41

Variance slope @ 5 km

33

Variance slope @ 10 km

-999

Variance slope @ 20 km

-999


NDVI (max. NDVI composite)


Roman et al. (2009) index


St

6.41940629993

Rcv

-0.0909668033213

Rse

0.0

Rst

0.0313675419745

Rsv

0.344998591713


NDVI range @ 1km [-]

0.04

NDVI range @ 2km [-]

0.08

NDVI range @ 5km [-]

0.08

NDVI range @ 10km [-]

0.07

NDVI range @ 20km [-]

0.08


Variance slope @ 1 km

9.74206175144e-05

Variance slope @ 2 km

9.34401132962e-05

Variance slope @ 5 km

6.97238523187e-05

Variance slope @ 10 km

3.87951544206e-05

Variance slope @ 20 km

2.09675666908e-05


NDVI (min. NDVI composite)I


Roman et al. (2009) index


St

2.66986069951

Rcv

0.112660191577

Rse

0.0

Rst

0.0612418472996

Rsv

0.949752090549


NDVI range @ 1km [-]

0.03

NDVI range @ 2km [-]

0.06

NDVI range @ 5km [-]

0.09

NDVI range @ 10km [-]

0.08

NDVI range @ 20km [-]

0.09


NDVI slope @ 1 km

6.75415696845e-05

NDVI slope @ 2 km

6.94467753253e-05

NDVI slope @ 5 km

6.45342921997e-05

NDVI slope @ 10 km

4.88811045481e-05

NDVI slope @ 20 km

3.98921663745e-05


Temporal stability analysis

+000 deg (BHR)


BHR statistics

Temporal stability [1/decade]:


abs

rel


Weighted least square:

None


Ordinary least square:

None


Probabilities that GCOS criteria is met:

Weighted least square:

None %

Ordinary least square:

None %


DHR statistics

Temporal stability [1/decade]:


abs

rel


Weighted least square:

None


Ordinary least square:

None


Probabilities that GCOS criteria is met:

Weighted least square:

None %

Ordinary least square:

None %


+057/+063 deg (BHR)


BHR statistics

Temporal stability [1/decade]:


abs

rel


Weighted least square:

None


Ordinary least square:

None


Probabilities that GCOS criteria is met:

Weighted least square:

None %

Ordinary least square:

None %


DHR statistics

Temporal stability [1/decade]:


abs

rel


Weighted least square:

None


Ordinary least square:

None


Probabilities that GCOS criteria is met:

Weighted least square:

None %

Ordinary least square:

None %


Temporal anomaly analyis

The variance of the temporal anomalies provides an additional measure about the stability of the signal AFTER removal of the mean seasonal cylce.

+000 deg


+057/+063 deg