BUWEIHA_GEZIRA


Location

lon / lat [deg]: 32.64 / 15.23

Source network: ALBEDOVAL1


Geostationary surface albedo (GSA) data


“+000”


“+057/+063”


Landcover information (based on ESA CCI landcover data)


Landcover fractions @ 2km distance


Landcover fractions @ 20 km distance


Legend


Distance to open water bodies [km]:

14.33

Distance to urban areas [km]:

11.32


Radius: 1 km

Number of landcover classes:

2

Dominant landcover type:

130: grassland

Fraction of dominant landcover type [%]:

73.0


Radius: 2 km

Number of landcover classes:

2

Dominant landcover type:

130: grassland

Fraction of dominant landcover type [%]:

54.0


Radius: 5 km

Number of landcover classes:

5

Dominant landcover type:

130: grassland

Fraction of dominant landcover type [%]:

56.0


Radius: 10 km

Number of landcover classes:

5

Dominant landcover type:

130: grassland

Fraction of dominant landcover type [%]:

53.0


Radius: 20 km

Number of landcover classes:

7

Dominant landcover type:

130: grassland

Fraction of dominant landcover type [%]:

43.0


Disturbances


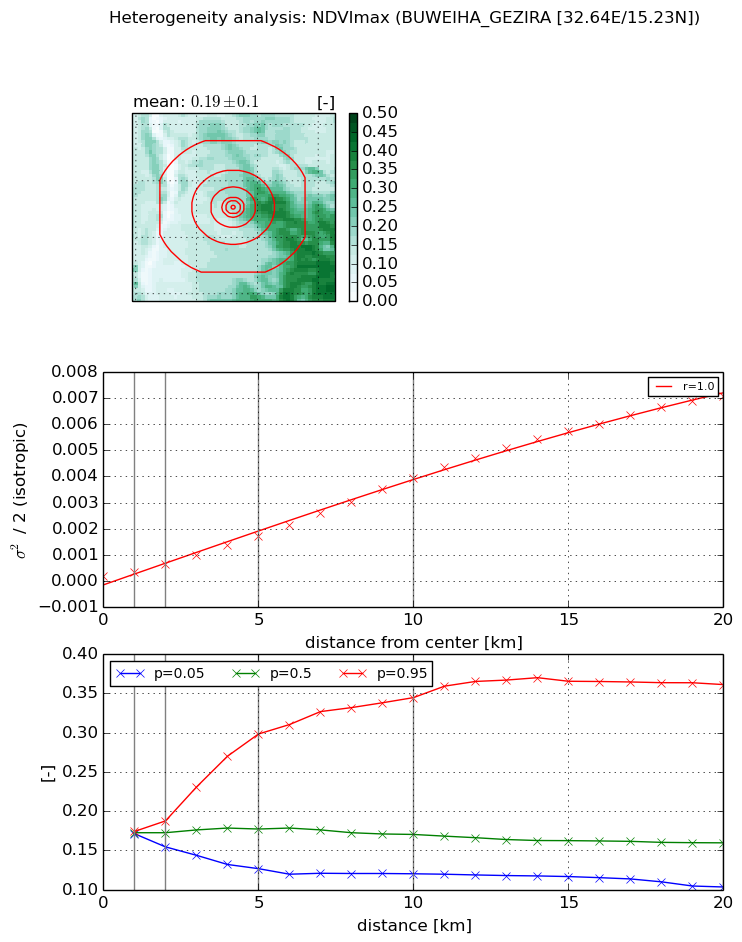
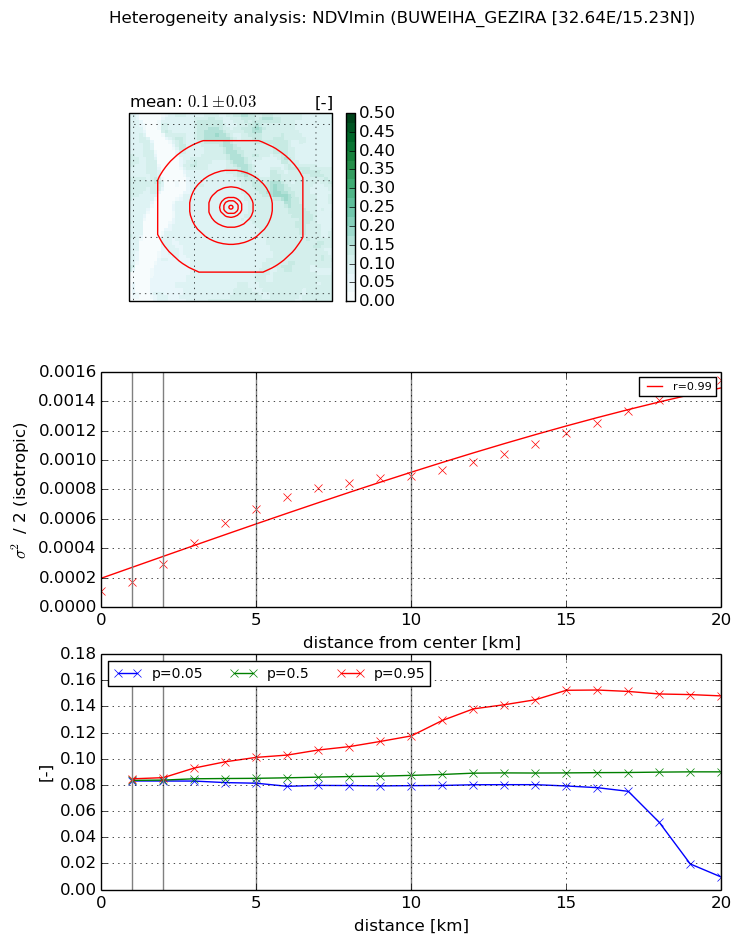
Heterogeneity analysis

The heterogeneity analysis provides information about the spatial and temporal heterogeneity of the site.

Topography


Roman et al. (2009) index


St

40.9298613064

Rcv

0.0231507257874

Rse

0.0

Rst

0.0409224121678

Rsv

0.00922298141198


Height range @ 1km [m]

5

Height range @ 2km [m]

5

Height range @ 5km [m]

5

Height range @ 10km [m]

-999

Height range @ 20km [m]

-999


Variance slope @ 1 km

0

Variance slope @ 2 km

0

Variance slope @ 5 km

0

Variance slope @ 10 km

-999

Variance slope @ 20 km

-999


NDVI (max. NDVI composite)


Roman et al. (2009) index


St

1.78864507021

Rcv

0.683298424598

Rse

0.0

Rst

-5.58616731267e-06

Rsv

-0.993943225125


NDVI range @ 1km [-]

0.0

NDVI range @ 2km [-]

0.03

NDVI range @ 5km [-]

0.17

NDVI range @ 10km [-]

0.22

NDVI range @ 20km [-]

0.26


Variance slope @ 1 km

0.000168730554358

Variance slope @ 2 km

0.000238461040788

Variance slope @ 5 km

0.000320830237904

Variance slope @ 10 km

0.000386626727948

Variance slope @ 20 km

0.000371464719406


NDVI (min. NDVI composite)I


Roman et al. (2009) index


St

1.54400510292

Rcv

0.955397670849

Rse

0.0

Rst

-2.36198352048e-06

Rsv

-0.987598726902


NDVI range @ 1km [-]

0.0

NDVI range @ 2km [-]

0.0

NDVI range @ 5km [-]

0.02

NDVI range @ 10km [-]

0.04

NDVI range @ 20km [-]

0.14


NDVI slope @ 1 km

6.48723745848e-05

NDVI slope @ 2 km

9.08262404592e-05

NDVI slope @ 5 km

0.00011846025378

NDVI slope @ 10 km

8.45938094528e-05

NDVI slope @ 20 km

6.55690518239e-05


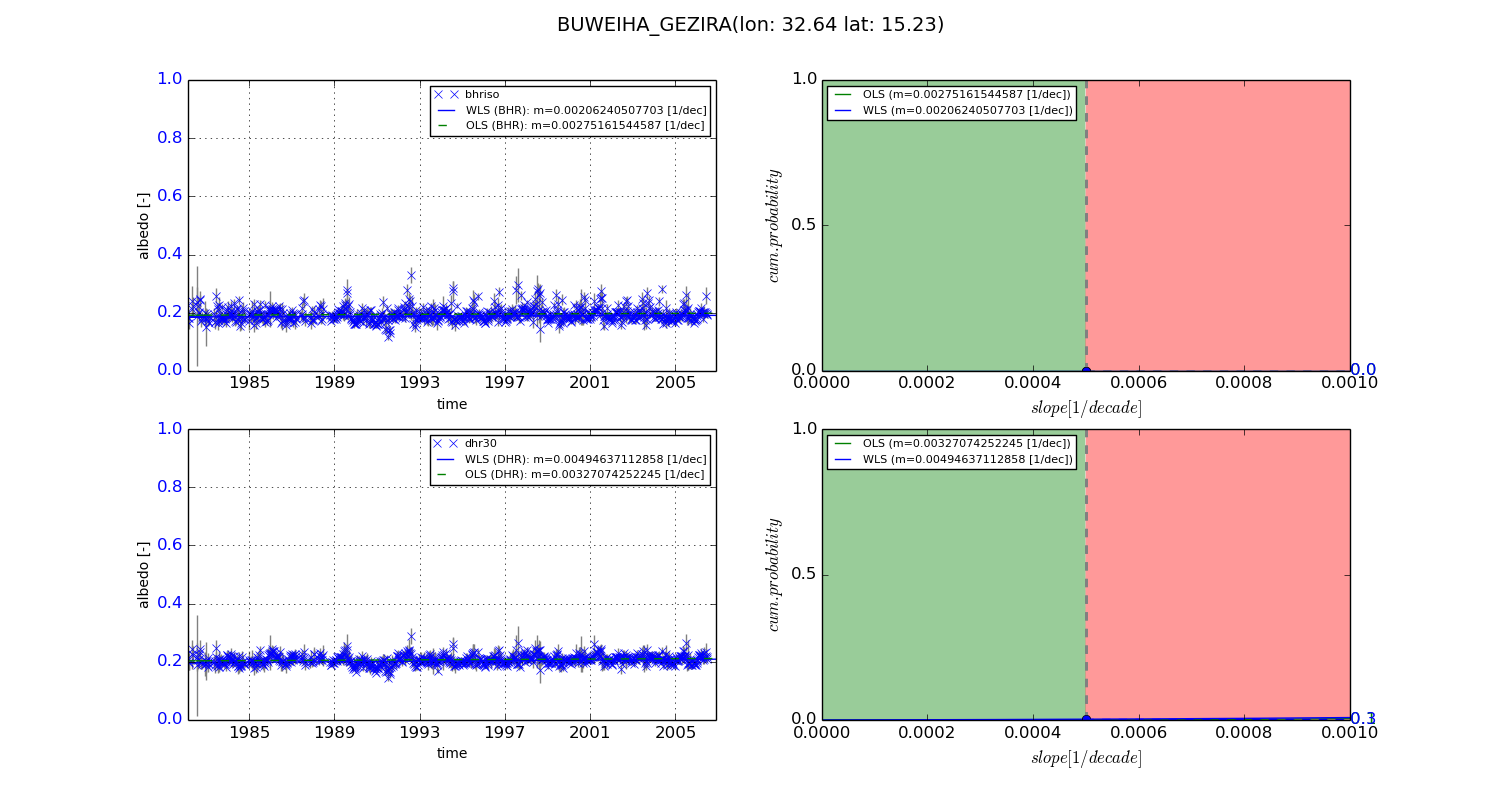
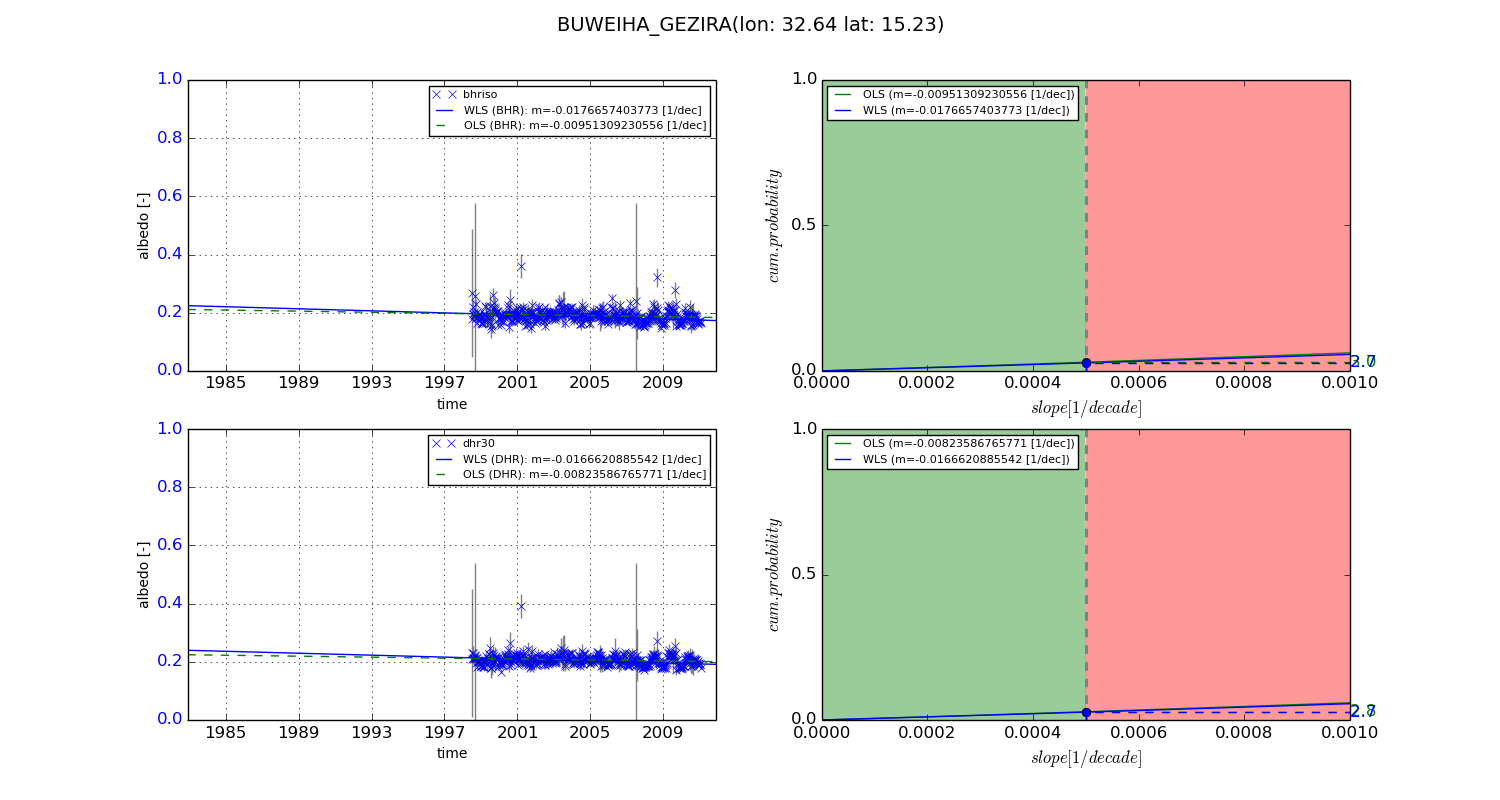
Temporal stability analysis

+000 deg (BHR)


BHR statistics

Temporal stability [1/decade]:


abs

rel


Weighted least square:

0.00206240507703


Ordinary least square:

0.00275161544587


Probabilities that GCOS criteria is met:

Weighted least square:

0.0 %

Ordinary least square:

0.0 %


DHR statistics

Temporal stability [1/decade]:


abs

rel


Weighted least square:

0.00494637112858


Ordinary least square:

0.00327074252245


Probabilities that GCOS criteria is met:

Weighted least square:

0.3 %

Ordinary least square:

0.1 %


+057/+063 deg (BHR)


BHR statistics

Temporal stability [1/decade]:


abs

rel


Weighted least square:

-0.0176657403773


Ordinary least square:

-0.00951309230556


Probabilities that GCOS criteria is met:

Weighted least square:

2.7 %

Ordinary least square:

3.0 %


DHR statistics

Temporal stability [1/decade]:


abs

rel


Weighted least square:

-0.0166620885542


Ordinary least square:

-0.00823586765771


Probabilities that GCOS criteria is met:

Weighted least square:

2.7 %

Ordinary least square:

2.8 %


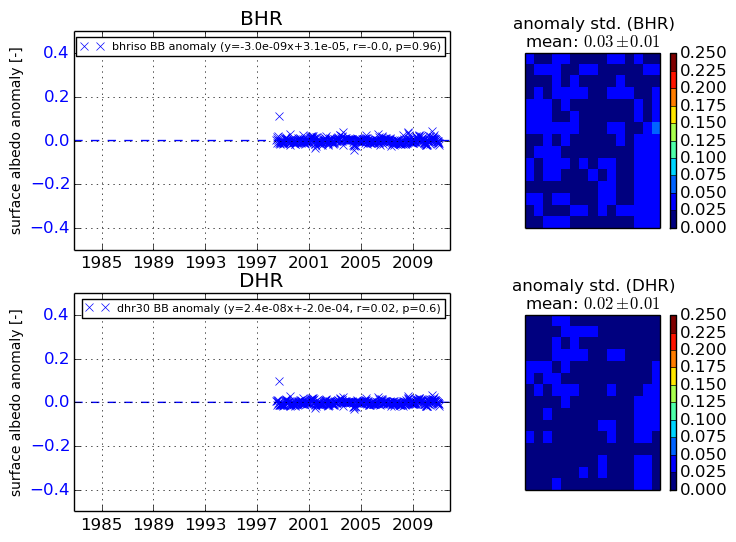
Temporal anomaly analyis

The variance of the temporal anomalies provides an additional measure about the stability of the signal AFTER removal of the mean seasonal cylce.
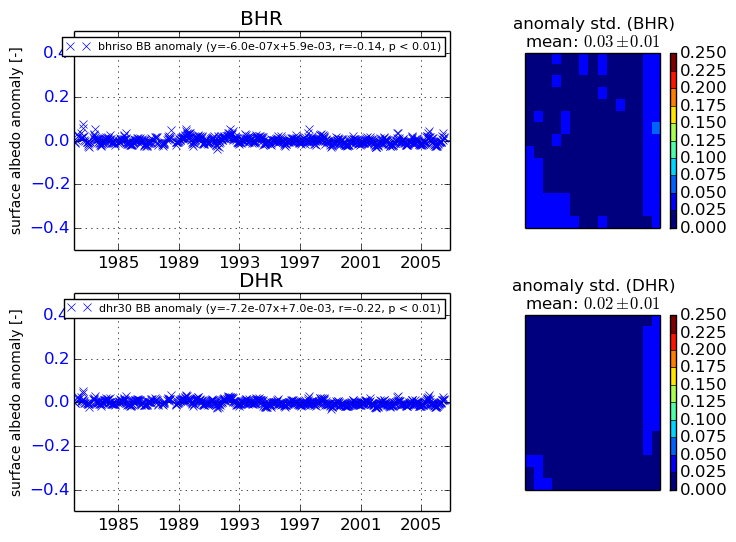
+000 deg


+057/+063 deg