BW-GHG


Location

lon / lat [deg]: 21.74 / -21.51

Source network: FLUXNET


Geostationary surface albedo (GSA) data


“+000”


“+057/+063”


Landcover information (based on ESA CCI landcover data)


Landcover fractions @ 2km distance


Landcover fractions @ 20 km distance


Legend


Distance to open water bodies [km]:

48.25

Distance to urban areas [km]:

22.62


Radius: 1 km

Number of landcover classes:

1

Dominant landcover type:

130: grassland

Fraction of dominant landcover type [%]:

100.0


Radius: 2 km

Number of landcover classes:

1

Dominant landcover type:

130: grassland

Fraction of dominant landcover type [%]:

100.0


Radius: 5 km

Number of landcover classes:

1

Dominant landcover type:

130: grassland

Fraction of dominant landcover type [%]:

100.0


Radius: 10 km

Number of landcover classes:

1

Dominant landcover type:

130: grassland

Fraction of dominant landcover type [%]:

100.0


Radius: 20 km

Number of landcover classes:

1

Dominant landcover type:

130: grassland

Fraction of dominant landcover type [%]:

100.0


Disturbances


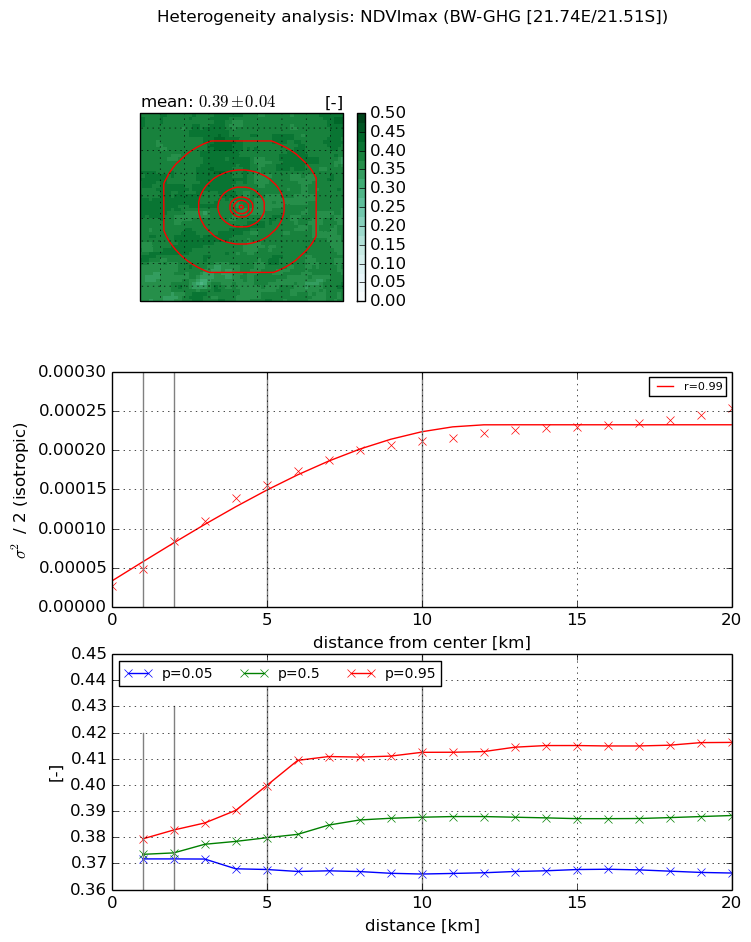
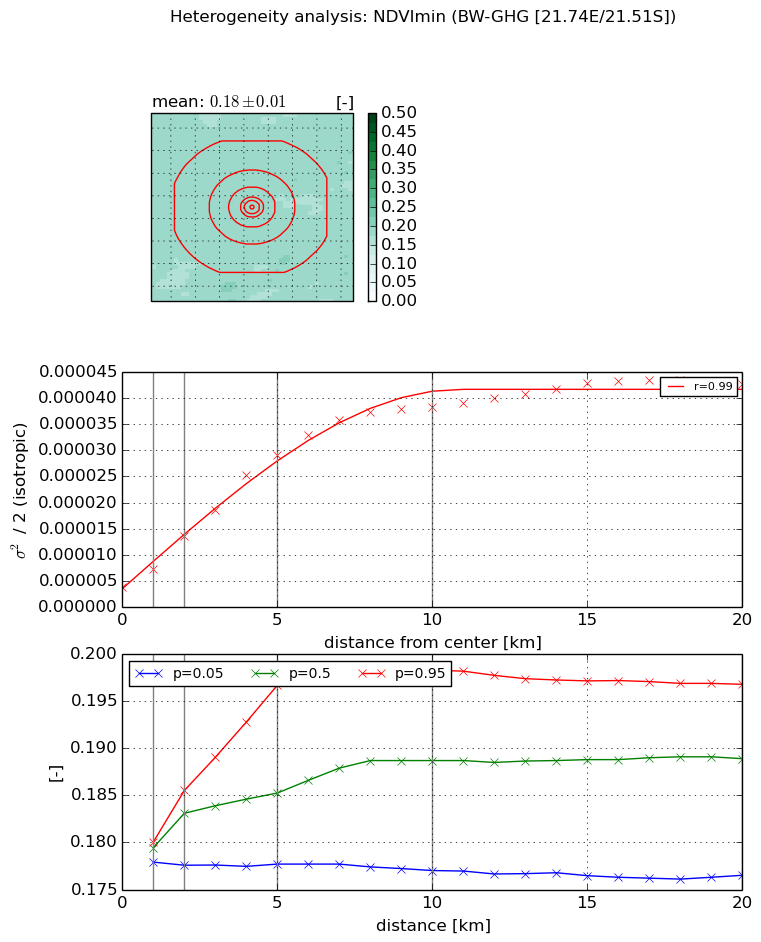
Heterogeneity analysis

The heterogeneity analysis provides information about the spatial and temporal heterogeneity of the site.

Topography


Roman et al. (2009) index


St

2.0496818593

Rcv

0.529652701601

Rse

0.0

Rst

-1.04900695105e-07

Rsv

-0.933988971068


Height range @ 1km [m]

2

Height range @ 2km [m]

5

Height range @ 5km [m]

11

Height range @ 10km [m]

-999

Height range @ 20km [m]

-999


Variance slope @ 1 km

1

Variance slope @ 2 km

1

Variance slope @ 5 km

3

Variance slope @ 10 km

-999

Variance slope @ 20 km

-999


NDVI (max. NDVI composite)


Roman et al. (2009) index


St

0.324917890227

Rcv

1.49562142425

Rse

0.0

Rst

-0.646809440013

Rsv

7.09067106775


NDVI range @ 1km [-]

0.01

NDVI range @ 2km [-]

0.01

NDVI range @ 5km [-]

0.03

NDVI range @ 10km [-]

0.05

NDVI range @ 20km [-]

0.05


Variance slope @ 1 km

2.11766850992e-05

Variance slope @ 2 km

2.86949528594e-05

Variance slope @ 5 km

2.69283156076e-05

Variance slope @ 10 km

1.89977585768e-05

Variance slope @ 20 km

9.68253385954e-06


NDVI (min. NDVI composite)I


Roman et al. (2009) index


St

2.68851229279e-07

Rcv

0.544145568353

Rse

0.0

Rst

0.34585122498

Rsv

11158586.735


NDVI range @ 1km [-]

0.0

NDVI range @ 2km [-]

0.01

NDVI range @ 5km [-]

0.02

NDVI range @ 10km [-]

0.02

NDVI range @ 20km [-]

0.02


NDVI slope @ 1 km

3.49661585631e-06

NDVI slope @ 2 km

4.85499794019e-06

NDVI slope @ 5 km

5.28224056043e-06

NDVI slope @ 10 km

3.70309636404e-06

NDVI slope @ 20 km

1.75754059336e-06


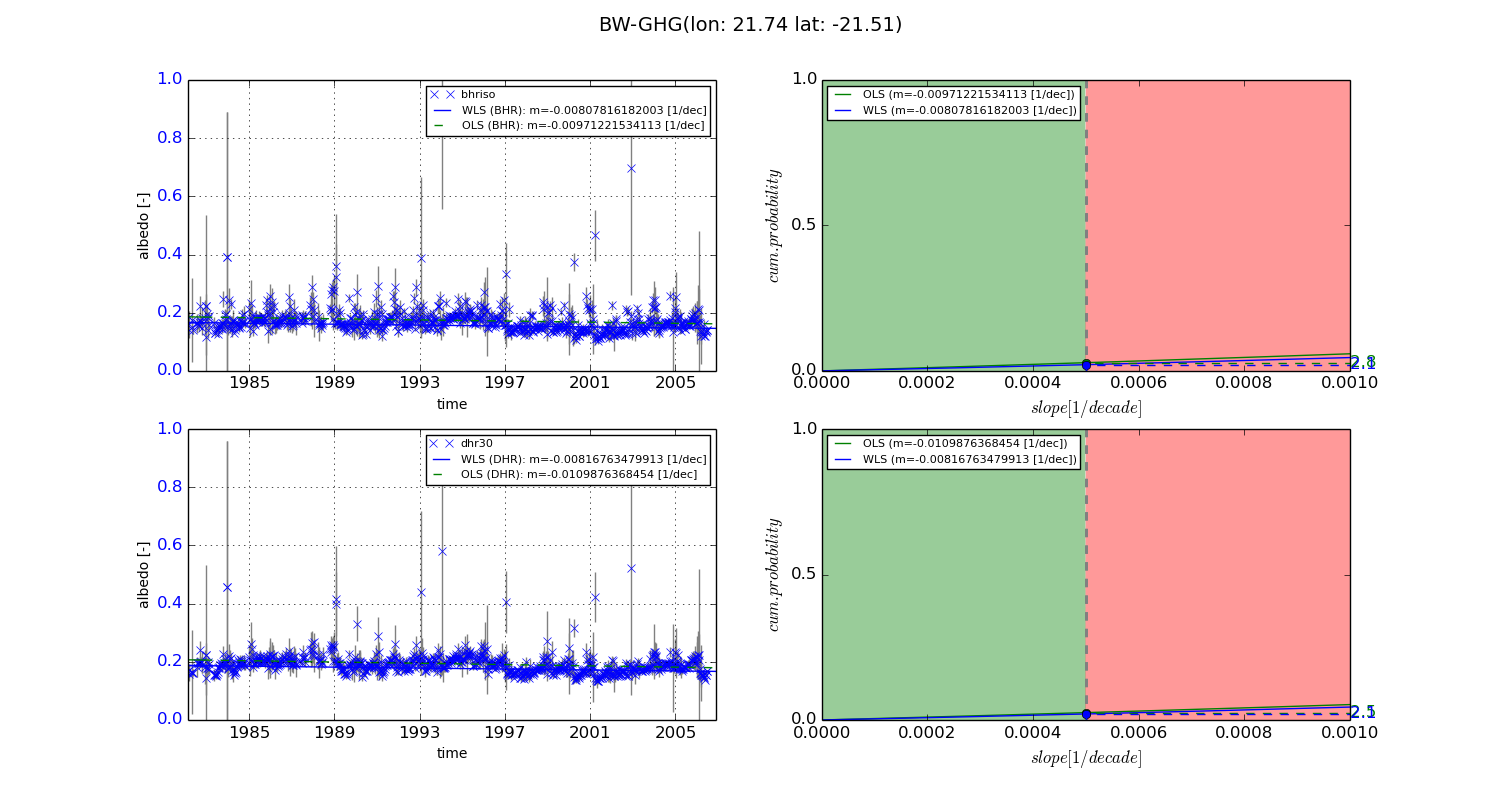
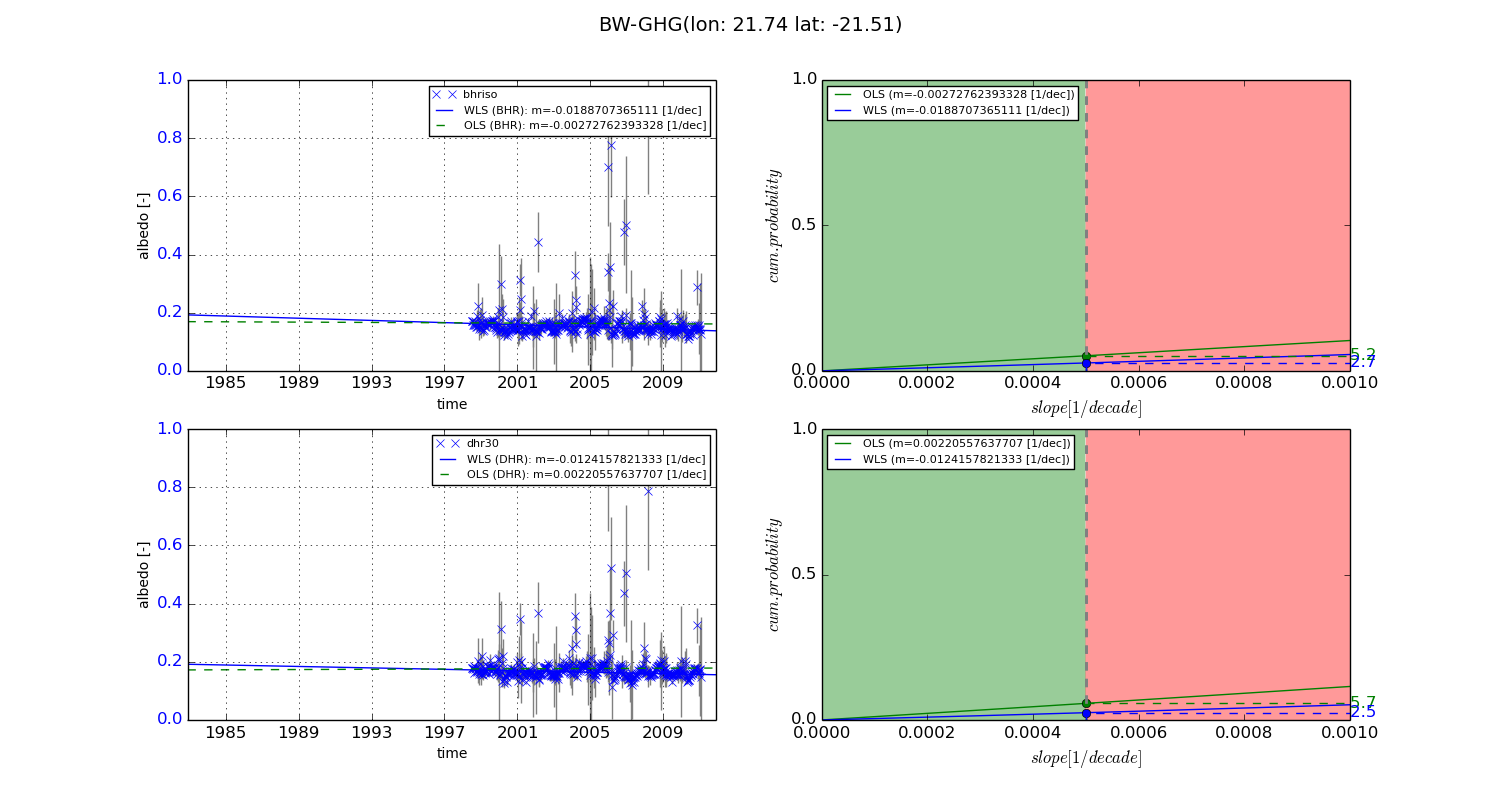
Temporal stability analysis

+000 deg (BHR)


BHR statistics

Temporal stability [1/decade]:


abs

rel


Weighted least square:

-0.00807816182003


Ordinary least square:

-0.00971221534113


Probabilities that GCOS criteria is met:

Weighted least square:

2.1 %

Ordinary least square:

2.8 %


DHR statistics

Temporal stability [1/decade]:


abs

rel


Weighted least square:

-0.00816763479913


Ordinary least square:

-0.0109876368454


Probabilities that GCOS criteria is met:

Weighted least square:

2.1 %

Ordinary least square:

2.5 %


+057/+063 deg (BHR)


BHR statistics

Temporal stability [1/decade]:


abs

rel


Weighted least square:

-0.0188707365111


Ordinary least square:

-0.00272762393328


Probabilities that GCOS criteria is met:

Weighted least square:

2.7 %

Ordinary least square:

5.2 %


DHR statistics

Temporal stability [1/decade]:


abs

rel


Weighted least square:

-0.0124157821333


Ordinary least square:

0.00220557637707


Probabilities that GCOS criteria is met:

Weighted least square:

2.5 %

Ordinary least square:

5.7 %


Temporal anomaly analyis

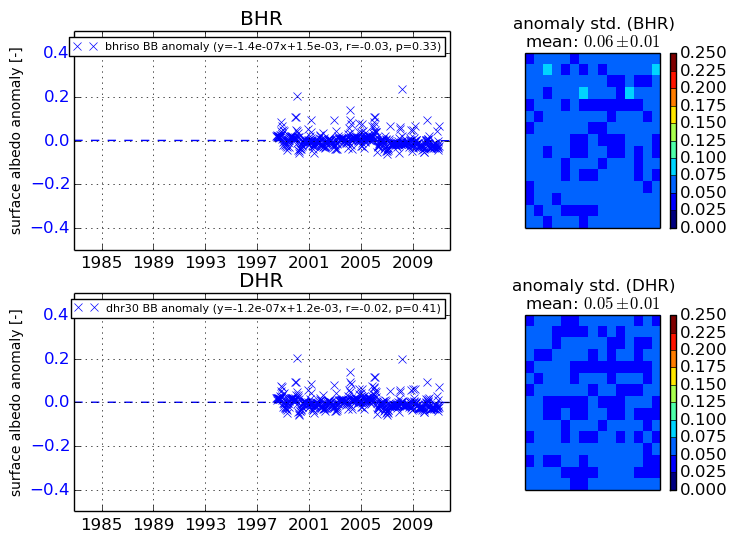
The variance of the temporal anomalies provides an additional measure about the stability of the signal AFTER removal of the mean seasonal cylce.
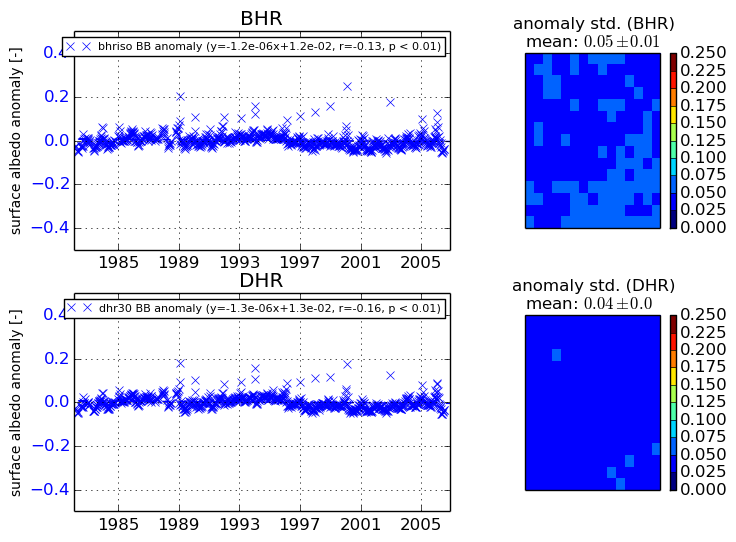
+000 deg


+057/+063 deg