BW-MA1


Location

lon / lat [deg]: 23.5605 / -19.9155

Source network: FLUXNET


Geostationary surface albedo (GSA) data


“+000”


“+057/+063”


Landcover information (based on ESA CCI landcover data)


Landcover fractions @ 2km distance


Landcover fractions @ 20 km distance


Legend


Distance to open water bodies [km]:

42.05

Distance to urban areas [km]:

14.21


Radius: 1 km

Number of landcover classes:

1

Dominant landcover type:

10: cropland, rainfed

Fraction of dominant landcover type [%]:

100.0


Radius: 2 km

Number of landcover classes:

2

Dominant landcover type:

10: cropland, rainfed

Fraction of dominant landcover type [%]:

99.0


Radius: 5 km

Number of landcover classes:

6

Dominant landcover type:

10: cropland, rainfed

Fraction of dominant landcover type [%]:

74.0


Radius: 10 km

Number of landcover classes:

6

Dominant landcover type:

10: cropland, rainfed

Fraction of dominant landcover type [%]:

51.0


Radius: 20 km

Number of landcover classes:

5

Dominant landcover type:

10: cropland, rainfed

Fraction of dominant landcover type [%]:

38.0


Disturbances


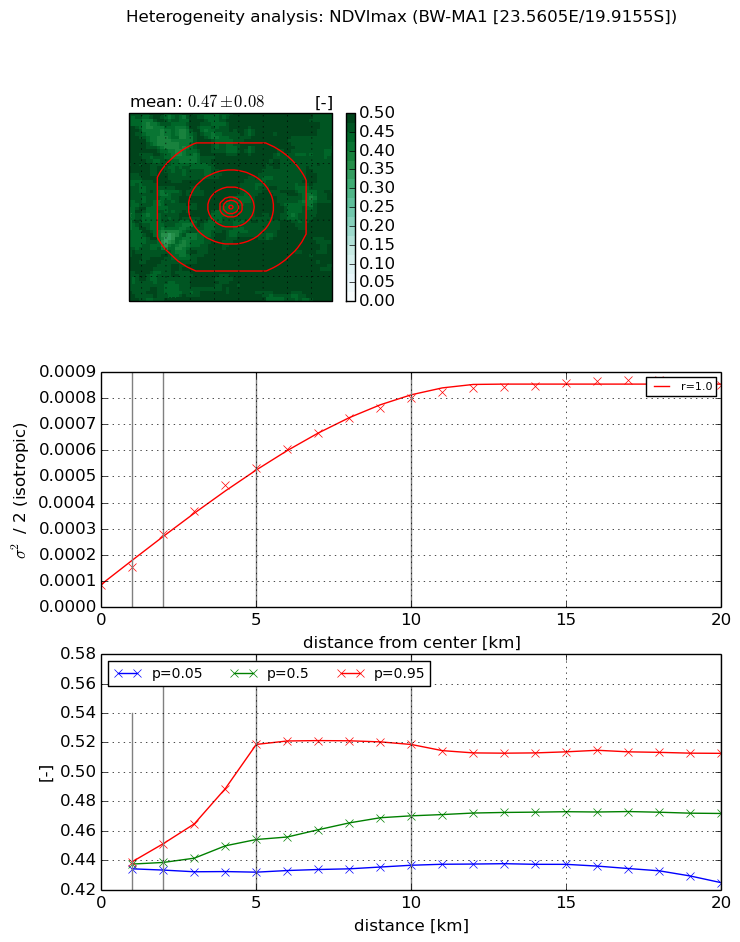
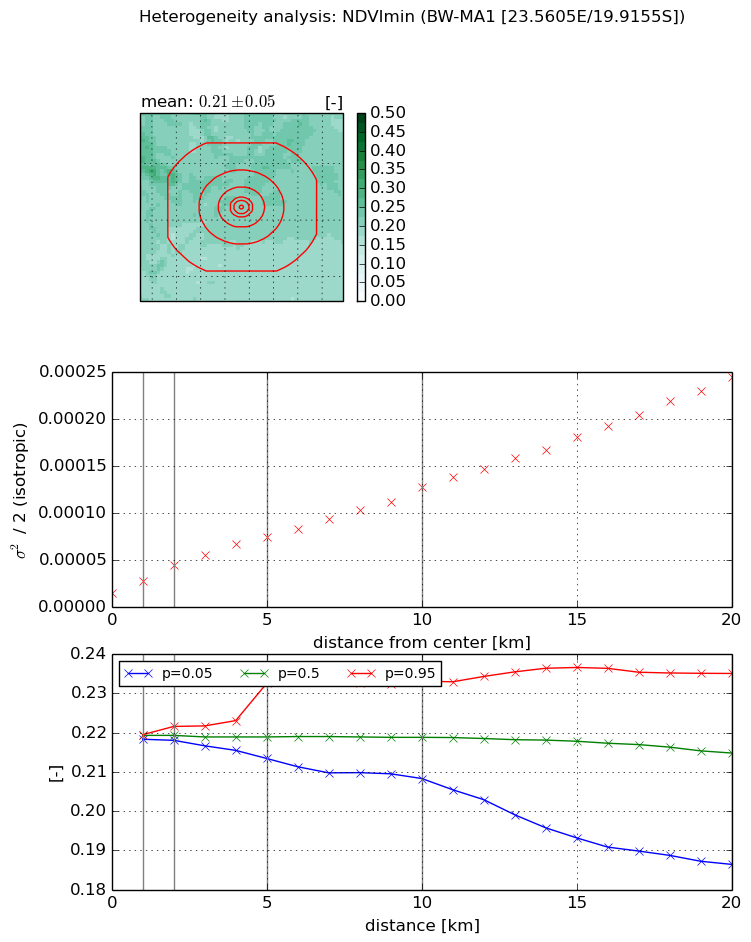
Heterogeneity analysis

The heterogeneity analysis provides information about the spatial and temporal heterogeneity of the site.

Topography


Roman et al. (2009) index


St

0.00108692707594

Rcv

1.2413030633

Rse

0.0

Rst

-0.03839142545

Rsv

2758.79507631


Height range @ 1km [m]

5

Height range @ 2km [m]

5

Height range @ 5km [m]

14

Height range @ 10km [m]

-999

Height range @ 20km [m]

-999


Variance slope @ 1 km

4

Variance slope @ 2 km

3

Variance slope @ 5 km

3

Variance slope @ 10 km

-999

Variance slope @ 20 km

-999


NDVI (max. NDVI composite)


Roman et al. (2009) index


St

1.22862697041

Rcv

0.996772901764

Rse

0.0

Rst

-0.296138313609

Rsv

1.14883886194


NDVI range @ 1km [-]

0.0

NDVI range @ 2km [-]

0.02

NDVI range @ 5km [-]

0.09

NDVI range @ 10km [-]

0.08

NDVI range @ 20km [-]

0.09


Variance slope @ 1 km

7.06429256143e-05

Variance slope @ 2 km

9.74525027239e-05

Variance slope @ 5 km

9.36505280543e-05

Variance slope @ 10 km

7.3447991867e-05

Variance slope @ 20 km

3.640972891e-05


NDVI (min. NDVI composite)I


Roman et al. (2009) index


St

nan

Rcv

nan

Rse

nan

Rst

nan

Rsv

nan


NDVI range @ 1km [-]

0.0

NDVI range @ 2km [-]

0.0

NDVI range @ 5km [-]

0.02

NDVI range @ 10km [-]

0.02

NDVI range @ 20km [-]

0.05


NDVI slope @ 1 km

1.20587978075e-05

NDVI slope @ 2 km

1.47445478989e-05

NDVI slope @ 5 km

1.21520572878e-05

NDVI slope @ 10 km

1.05560499235e-05

NDVI slope @ 20 km

1.0990489714e-05


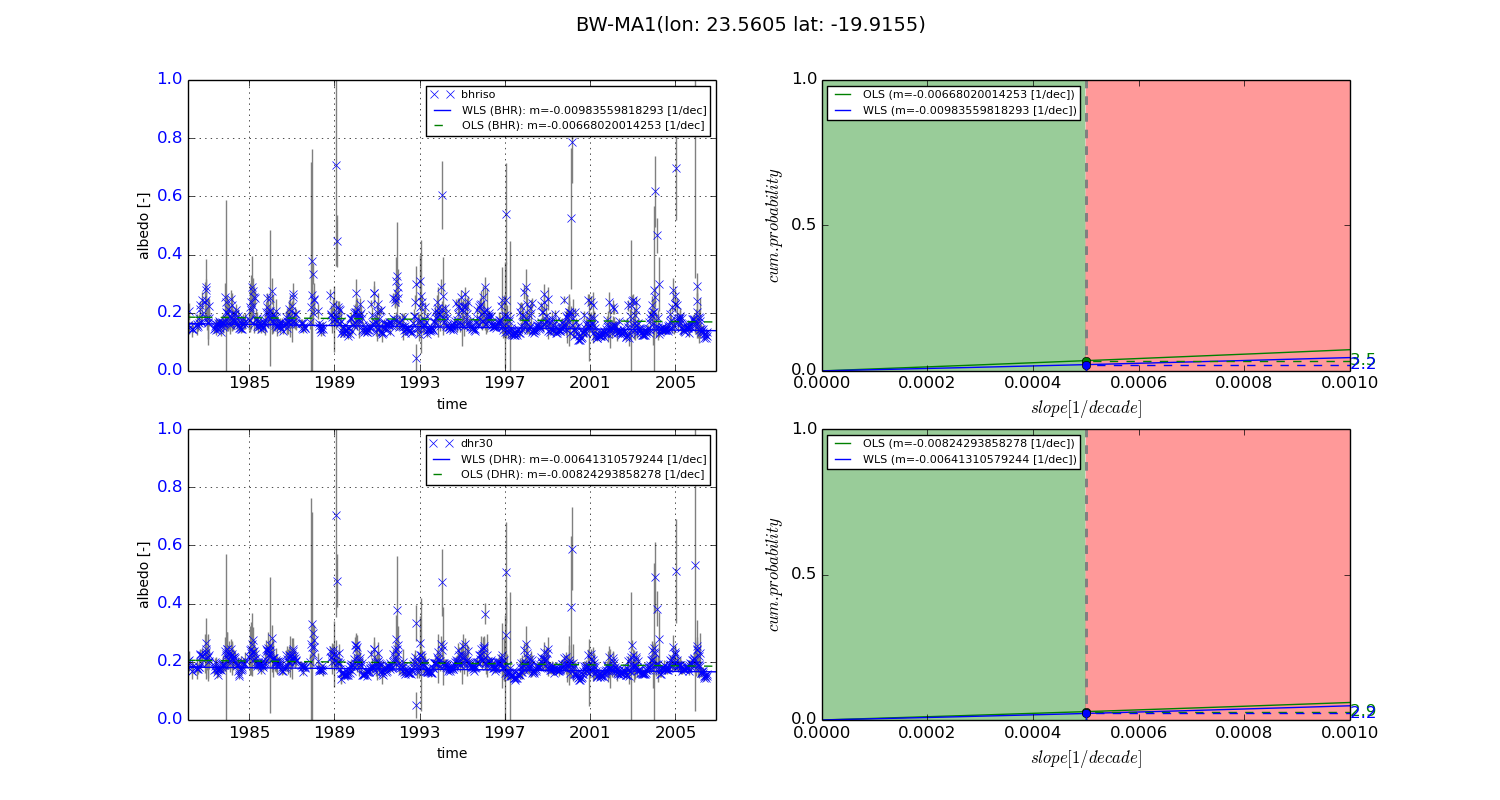
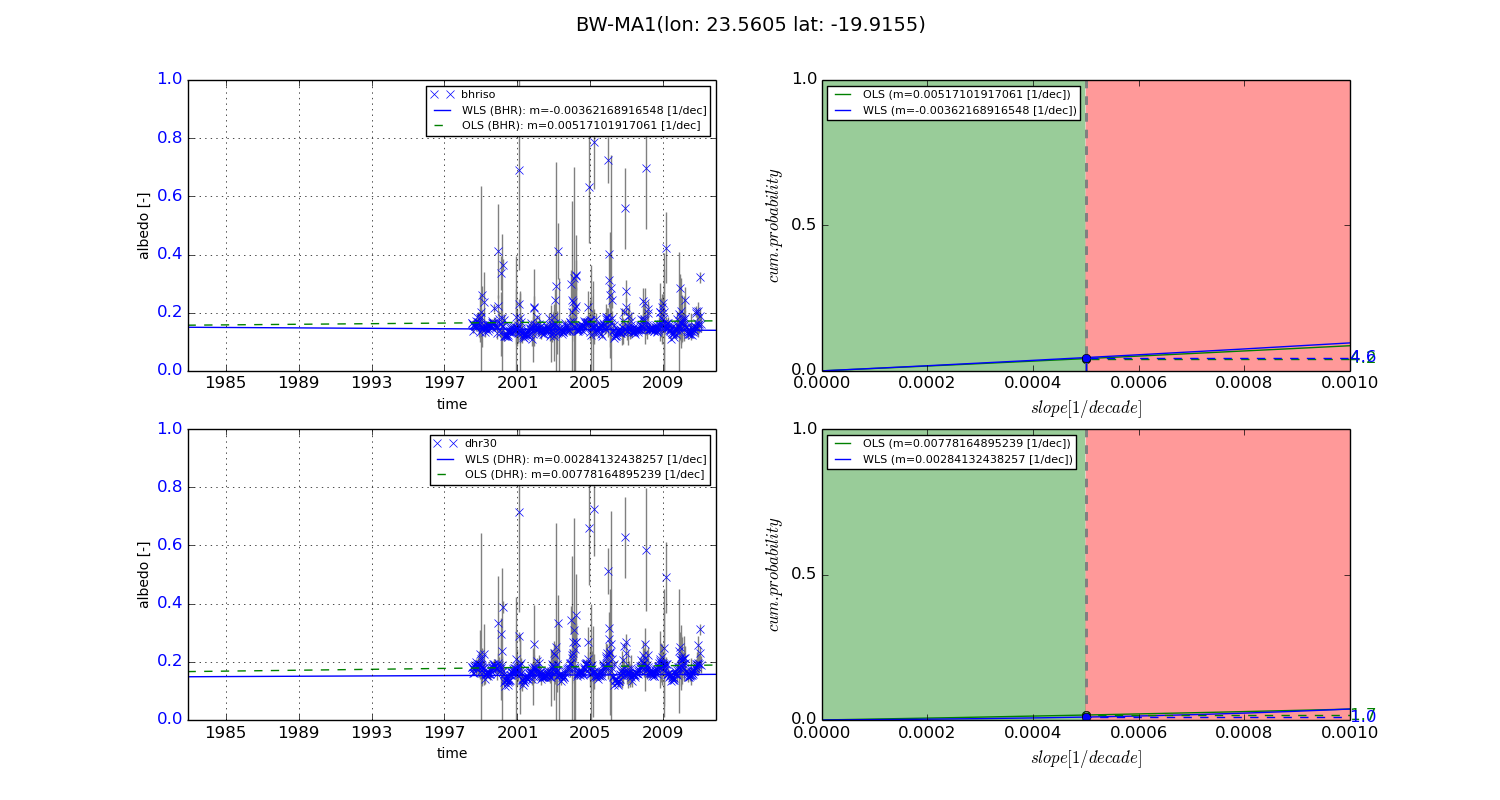
Temporal stability analysis

+000 deg (BHR)


BHR statistics

Temporal stability [1/decade]:


abs

rel


Weighted least square:

-0.00983559818293


Ordinary least square:

-0.00668020014253


Probabilities that GCOS criteria is met:

Weighted least square:

2.2 %

Ordinary least square:

3.5 %


DHR statistics

Temporal stability [1/decade]:


abs

rel


Weighted least square:

-0.00641310579244


Ordinary least square:

-0.00824293858278


Probabilities that GCOS criteria is met:

Weighted least square:

2.2 %

Ordinary least square:

2.9 %


+057/+063 deg (BHR)


BHR statistics

Temporal stability [1/decade]:


abs

rel


Weighted least square:

-0.00362168916548


Ordinary least square:

0.00517101917061


Probabilities that GCOS criteria is met:

Weighted least square:

4.6 %

Ordinary least square:

4.2 %


DHR statistics

Temporal stability [1/decade]:


abs

rel


Weighted least square:

0.00284132438257


Ordinary least square:

0.00778164895239


Probabilities that GCOS criteria is met:

Weighted least square:

1.0 %

Ordinary least square:

1.7 %


Temporal anomaly analyis

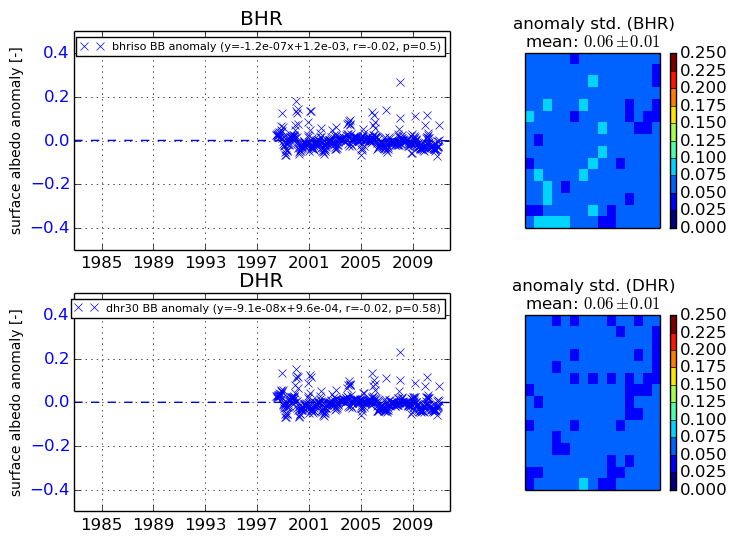
The variance of the temporal anomalies provides an additional measure about the stability of the signal AFTER removal of the mean seasonal cylce.
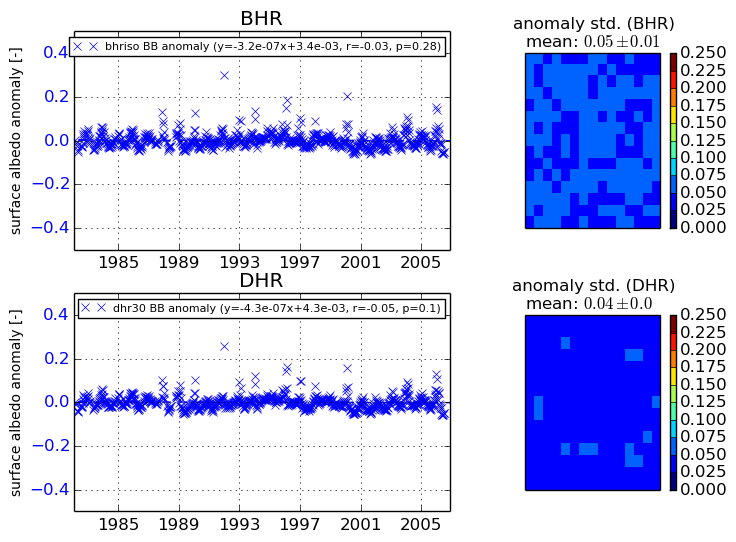
+000 deg


+057/+063 deg