CA-MER


Location

lon / lat [deg]: -75.5186 / 45.4094

Source network: FLUXNET


Geostationary surface albedo (GSA) data


“+000”


“+057/+063”


Landcover information (based on ESA CCI landcover data)


Landcover fractions @ 2km distance


Landcover fractions @ 20 km distance


Legend


Distance to open water bodies [km]:

8.14

Distance to urban areas [km]:

2.2


Radius: 1 km

Number of landcover classes:

3

Dominant landcover type:

62: Tree cover, broadleaved, decidous (open 15-40%)

Fraction of dominant landcover type [%]:

81.0


Radius: 2 km

Number of landcover classes:

6

Dominant landcover type:

62: Tree cover, broadleaved, decidous (open 15-40%)

Fraction of dominant landcover type [%]:

71.0


Radius: 5 km

Number of landcover classes:

7

Dominant landcover type:

62: Tree cover, broadleaved, decidous (open 15-40%)

Fraction of dominant landcover type [%]:

39.0


Radius: 10 km

Number of landcover classes:

7

Dominant landcover type:

190: urban areas

Fraction of dominant landcover type [%]:

26.0


Radius: 20 km

Number of landcover classes:

7

Dominant landcover type:

190: urban areas

Fraction of dominant landcover type [%]:

23.0


Disturbances


Heterogeneity analysis

The heterogeneity analysis provides information about the spatial and temporal heterogeneity of the site.

Topography


Roman et al. (2009) index


St

2.97061183702e-06

Rcv

0.28738308625

Rse

0.0

Rst

-0.0772977712785

Rsv

1009892.60168


Height range @ 1km [m]

5

Height range @ 2km [m]

11

Height range @ 5km [m]

24

Height range @ 10km [m]

-999

Height range @ 20km [m]

-999


Variance slope @ 1 km

29

Variance slope @ 2 km

19

Variance slope @ 5 km

14

Variance slope @ 10 km

-999

Variance slope @ 20 km

-999


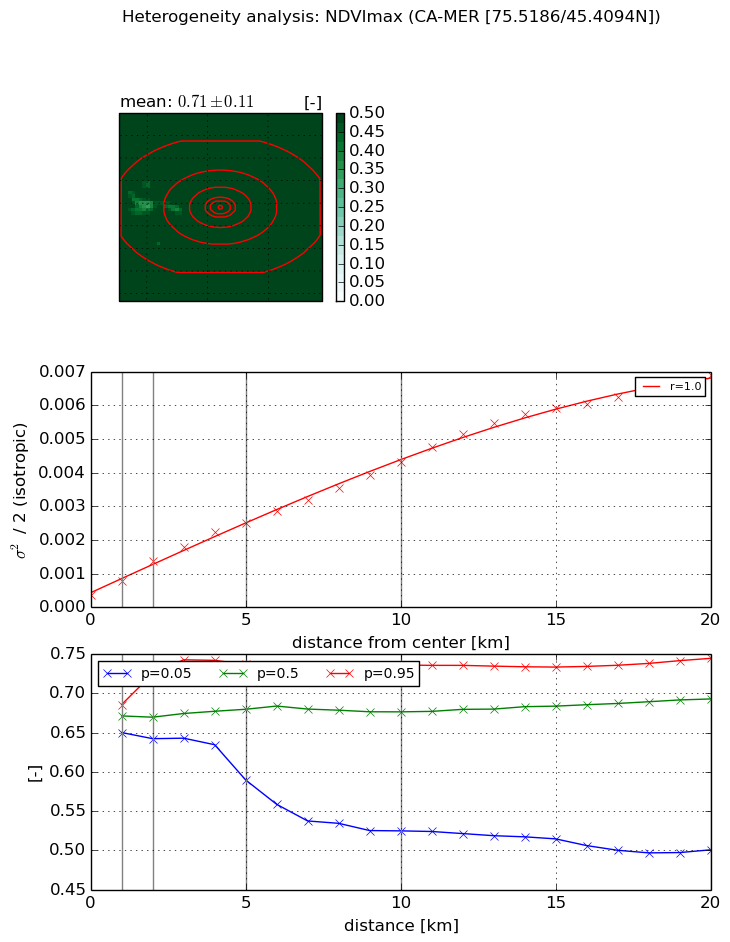
NDVI (max. NDVI composite)


Roman et al. (2009) index


St

2.01423774984

Rcv

0.237317316898

Rse

0.0

Rst

-0.252081159851

Rsv

-0.99999869111


NDVI range @ 1km [-]

0.04

NDVI range @ 2km [-]

0.08

NDVI range @ 5km [-]

0.15

NDVI range @ 10km [-]

0.21

NDVI range @ 20km [-]

0.24


Variance slope @ 1 km

0.000395410987286

Variance slope @ 2 km

0.000493798381266

Variance slope @ 5 km

0.000444262745256

Variance slope @ 10 km

0.00038533901954

Variance slope @ 20 km

0.000328037940166


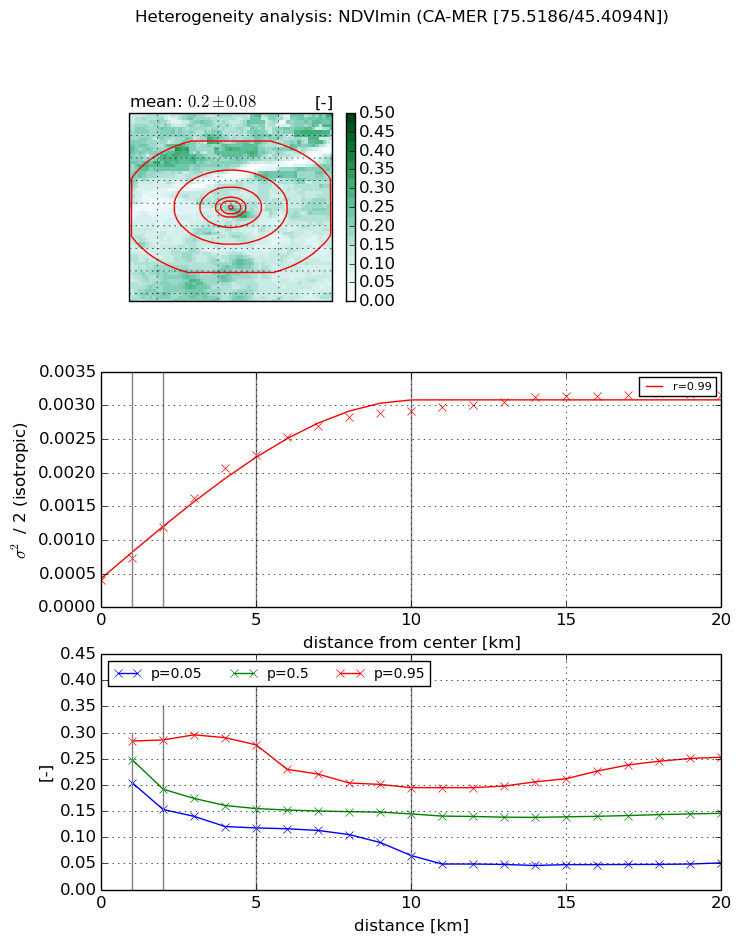
NDVI (min. NDVI composite)I


Roman et al. (2009) index


St

4.47428670206e-07

Rcv

-0.0172002936209

Rse

0.0

Rst

0.412929188864

Rsv

6704978.93254


NDVI range @ 1km [-]

0.08

NDVI range @ 2km [-]

0.13

NDVI range @ 5km [-]

0.16

NDVI range @ 10km [-]

0.13

NDVI range @ 20km [-]

0.2


NDVI slope @ 1 km

0.000318593663497

NDVI slope @ 2 km

0.000393197618118

NDVI slope @ 5 km

0.000392440911236

NDVI slope @ 10 km

0.000260640072774

NDVI slope @ 20 km

0.000118266360157


Temporal stability analysis

+000 deg (BHR)


BHR statistics

Temporal stability [1/decade]:


abs

rel


Weighted least square:

-99999.0


Ordinary least square:

-99999.0


Probabilities that GCOS criteria is met:

Weighted least square:

-99999.0 %

Ordinary least square:

-99999.0 %


DHR statistics

Temporal stability [1/decade]:


abs

rel


Weighted least square:

-99999.0


Ordinary least square:

-99999.0


Probabilities that GCOS criteria is met:

Weighted least square:

-99999.0 %

Ordinary least square:

-99999.0 %


+057/+063 deg (BHR)


BHR statistics

Temporal stability [1/decade]:


abs

rel


Weighted least square:

None


Ordinary least square:

None


Probabilities that GCOS criteria is met:

Weighted least square:

None %

Ordinary least square:

None %


DHR statistics

Temporal stability [1/decade]:


abs

rel


Weighted least square:

None


Ordinary least square:

None


Probabilities that GCOS criteria is met:

Weighted least square:

None %

Ordinary least square:

None %


Temporal anomaly analyis

The variance of the temporal anomalies provides an additional measure about the stability of the signal AFTER removal of the mean seasonal cylce.

+000 deg


+057/+063 deg