CA-NS5


Location

lon / lat [deg]: -98.485 / 55.8631

Source network: FLUXNET


Geostationary surface albedo (GSA) data


“+000”


“+057/+063”


Landcover information (based on ESA CCI landcover data)


Landcover fractions @ 2km distance


Landcover fractions @ 20 km distance


Legend


Distance to open water bodies [km]:

0.78

Distance to urban areas [km]:

none in region


Radius: 1 km

Number of landcover classes:

4

Dominant landcover type:

180: shrub or herbaceous cover, flooded, fresh/saline/brakish water

Fraction of dominant landcover type [%]:

59.0


Radius: 2 km

Number of landcover classes:

4

Dominant landcover type:

180: shrub or herbaceous cover, flooded, fresh/saline/brakish water

Fraction of dominant landcover type [%]:

48.0


Radius: 5 km

Number of landcover classes:

4

Dominant landcover type:

70: Tree cover, needleleaved, evergreen, closed to open (>15%)

Fraction of dominant landcover type [%]:

63.0


Radius: 10 km

Number of landcover classes:

5

Dominant landcover type:

70: Tree cover, needleleaved, evergreen, closed to open (>15%)

Fraction of dominant landcover type [%]:

54.0


Radius: 20 km

Number of landcover classes:

4

Dominant landcover type:

70: Tree cover, needleleaved, evergreen, closed to open (>15%)

Fraction of dominant landcover type [%]:

77.0


Disturbances


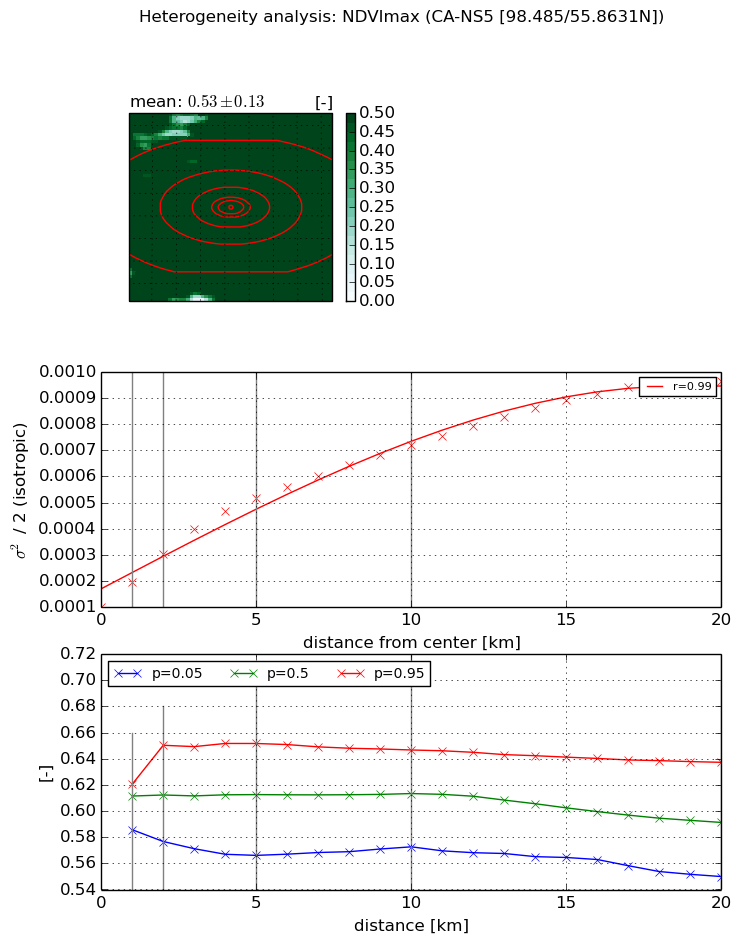
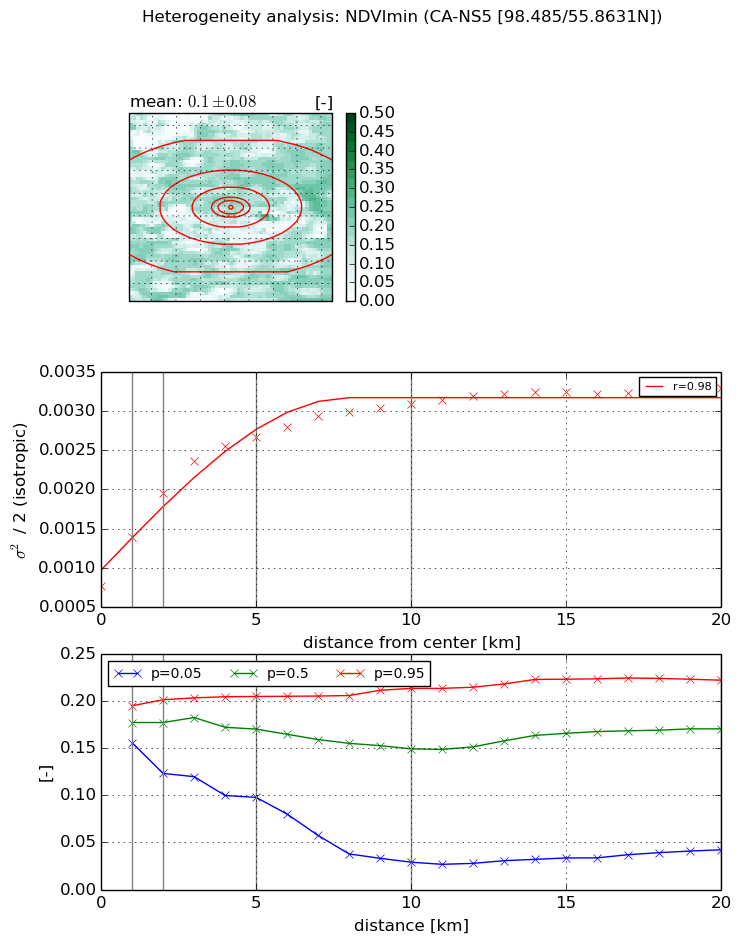
Heterogeneity analysis

The heterogeneity analysis provides information about the spatial and temporal heterogeneity of the site.

Topography


Roman et al. (2009) index


St

7.01283664772

Rcv

0.0829952445553

Rse

0.0

Rst

-0.0403712856883

Rsv

-0.304420419703


Height range @ 1km [m]

16

Height range @ 2km [m]

28

Height range @ 5km [m]

32

Height range @ 10km [m]

-999

Height range @ 20km [m]

-999


Variance slope @ 1 km

54

Variance slope @ 2 km

34

Variance slope @ 5 km

19

Variance slope @ 10 km

-999

Variance slope @ 20 km

-999


NDVI (max. NDVI composite)


Roman et al. (2009) index


St

4.65080750577

Rcv

0.0666710968303

Rse

0.0

Rst

-0.0463042565069

Rsv

0.532073919563


NDVI range @ 1km [-]

0.03

NDVI range @ 2km [-]

0.07

NDVI range @ 5km [-]

0.09

NDVI range @ 10km [-]

0.07

NDVI range @ 20km [-]

0.09


Variance slope @ 1 km

9.43236775512e-05

Variance slope @ 2 km

0.000100628249689

Variance slope @ 5 km

8.57184175007e-05

Variance slope @ 10 km

5.98105670124e-05

Variance slope @ 20 km

4.06228380658e-05


NDVI (min. NDVI composite)I


Roman et al. (2009) index


St

4.54744272437

Rcv

0.352559916299

Rse

0.0

Rst

-0.0697541422654

Rsv

0.237397384073


NDVI range @ 1km [-]

0.04

NDVI range @ 2km [-]

0.08

NDVI range @ 5km [-]

0.11

NDVI range @ 10km [-]

0.18

NDVI range @ 20km [-]

0.18


NDVI slope @ 1 km

0.000617481795527

NDVI slope @ 2 km

0.000591486178672

NDVI slope @ 5 km

0.000381393326614

NDVI slope @ 10 km

0.000205966561608

NDVI slope @ 20 km

8.90338855818e-05


Temporal stability analysis

+000 deg (BHR)


BHR statistics

Temporal stability [1/decade]:


abs

rel


Weighted least square:

None


Ordinary least square:

None


Probabilities that GCOS criteria is met:

Weighted least square:

None %

Ordinary least square:

None %


DHR statistics

Temporal stability [1/decade]:


abs

rel


Weighted least square:

None


Ordinary least square:

None


Probabilities that GCOS criteria is met:

Weighted least square:

None %

Ordinary least square:

None %


+057/+063 deg (BHR)


BHR statistics

Temporal stability [1/decade]:


abs

rel


Weighted least square:

None


Ordinary least square:

None


Probabilities that GCOS criteria is met:

Weighted least square:

None %

Ordinary least square:

None %


DHR statistics

Temporal stability [1/decade]:


abs

rel


Weighted least square:

None


Ordinary least square:

None


Probabilities that GCOS criteria is met:

Weighted least square:

None %

Ordinary least square:

None %


Temporal anomaly analyis

The variance of the temporal anomalies provides an additional measure about the stability of the signal AFTER removal of the mean seasonal cylce.

+000 deg


+057/+063 deg