CA-NS7


Location

lon / lat [deg]: -99.9483 / 56.6358

Source network: FLUXNET


Geostationary surface albedo (GSA) data


“+000”


“+057/+063”


Landcover information (based on ESA CCI landcover data)


Landcover fractions @ 2km distance


Landcover fractions @ 20 km distance


Legend


Distance to open water bodies [km]:

0.53

Distance to urban areas [km]:

none in region


Radius: 1 km

Number of landcover classes:

3

Dominant landcover type:

70: Tree cover, needleleaved, evergreen, closed to open (>15%)

Fraction of dominant landcover type [%]:

53.0


Radius: 2 km

Number of landcover classes:

3

Dominant landcover type:

70: Tree cover, needleleaved, evergreen, closed to open (>15%)

Fraction of dominant landcover type [%]:

57.0


Radius: 5 km

Number of landcover classes:

4

Dominant landcover type:

70: Tree cover, needleleaved, evergreen, closed to open (>15%)

Fraction of dominant landcover type [%]:

74.0


Radius: 10 km

Number of landcover classes:

4

Dominant landcover type:

70: Tree cover, needleleaved, evergreen, closed to open (>15%)

Fraction of dominant landcover type [%]:

79.0


Radius: 20 km

Number of landcover classes:

4

Dominant landcover type:

70: Tree cover, needleleaved, evergreen, closed to open (>15%)

Fraction of dominant landcover type [%]:

71.0


Disturbances


Heterogeneity analysis

The heterogeneity analysis provides information about the spatial and temporal heterogeneity of the site.

Topography


Roman et al. (2009) index


St

2.59928527345

Rcv

0.137857718216

Rse

0.0

Rst

-0.0758763524179

Rsv

0.940429356769


Height range @ 1km [m]

34

Height range @ 2km [m]

51

Height range @ 5km [m]

71

Height range @ 10km [m]

-999

Height range @ 20km [m]

-999


Variance slope @ 1 km

171

Variance slope @ 2 km

131

Variance slope @ 5 km

86

Variance slope @ 10 km

-999

Variance slope @ 20 km

-999


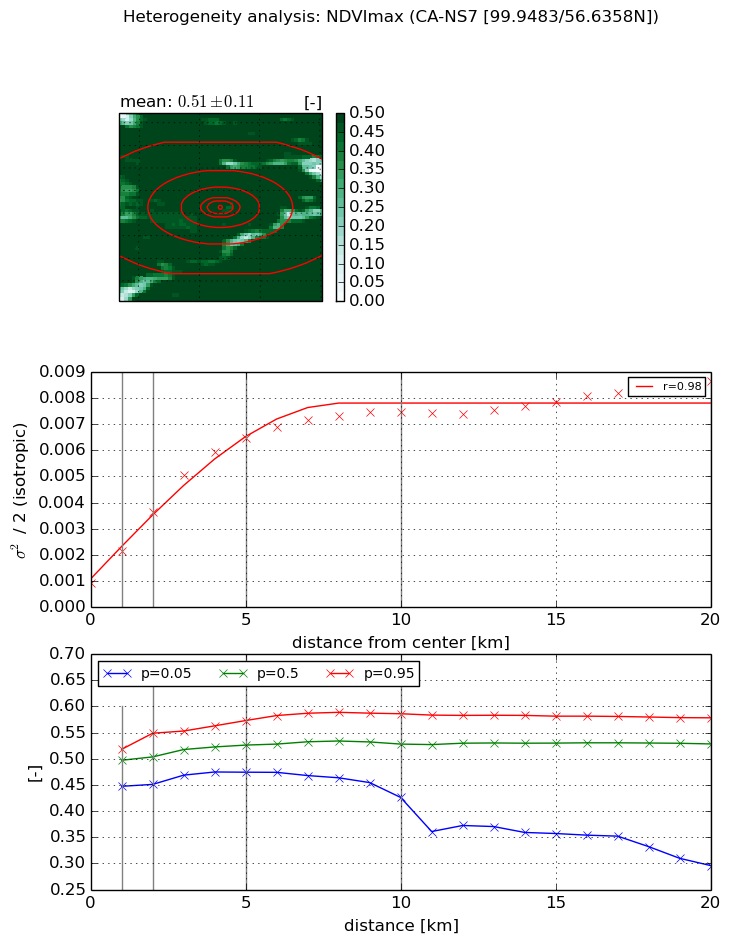
NDVI (max. NDVI composite)


Roman et al. (2009) index


St

2.17690204453

Rcv

0.0908719042144

Rse

0.0

Rst

-0.287233711573

Rsv

-0.999999571599


NDVI range @ 1km [-]

0.07

NDVI range @ 2km [-]

0.1

NDVI range @ 5km [-]

0.1

NDVI range @ 10km [-]

0.16

NDVI range @ 20km [-]

0.28


Variance slope @ 1 km

0.00122990640632

Variance slope @ 2 km

0.00135627698141

Variance slope @ 5 km

0.00115724291741

Variance slope @ 10 km

0.000637592529295

Variance slope @ 20 km

0.000282936027966


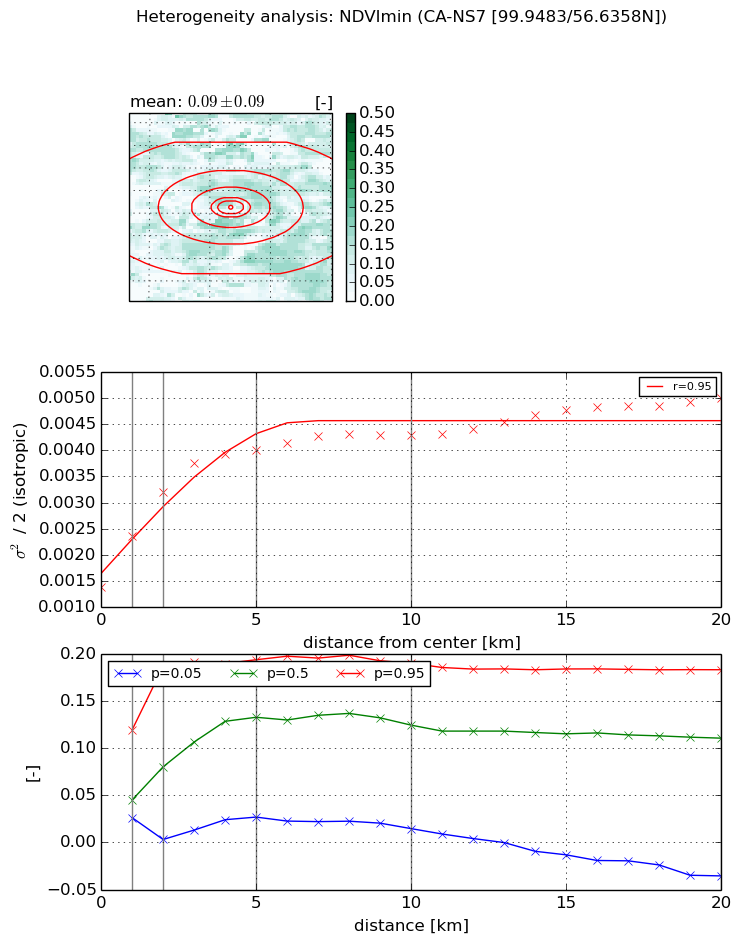
NDVI (min. NDVI composite)I


Roman et al. (2009) index


St

7.02949796764

Rcv

-0.222895074868

Rse

0.0

Rst

-0.045215559289

Rsv

0.158662374927


NDVI range @ 1km [-]

0.09

NDVI range @ 2km [-]

0.18

NDVI range @ 5km [-]

0.17

NDVI range @ 10km [-]

0.18

NDVI range @ 20km [-]

0.22


NDVI slope @ 1 km

0.000993627815058

NDVI slope @ 2 km

0.000911492957418

NDVI slope @ 5 km

0.000525375160049

NDVI slope @ 10 km

0.000244229311666

NDVI slope @ 20 km

0.000120035048398


Temporal stability analysis

+000 deg (BHR)


BHR statistics

Temporal stability [1/decade]:


abs

rel


Weighted least square:

None


Ordinary least square:

None


Probabilities that GCOS criteria is met:

Weighted least square:

None %

Ordinary least square:

None %


DHR statistics

Temporal stability [1/decade]:


abs

rel


Weighted least square:

None


Ordinary least square:

None


Probabilities that GCOS criteria is met:

Weighted least square:

None %

Ordinary least square:

None %


+057/+063 deg (BHR)


BHR statistics

Temporal stability [1/decade]:


abs

rel


Weighted least square:

None


Ordinary least square:

None


Probabilities that GCOS criteria is met:

Weighted least square:

None %

Ordinary least square:

None %


DHR statistics

Temporal stability [1/decade]:


abs

rel


Weighted least square:

None


Ordinary least square:

None


Probabilities that GCOS criteria is met:

Weighted least square:

None %

Ordinary least square:

None %


Temporal anomaly analyis

The variance of the temporal anomalies provides an additional measure about the stability of the signal AFTER removal of the mean seasonal cylce.

+000 deg


+057/+063 deg