CA-OBS


Location

lon / lat [deg]: -105.118 / 53.9872

Source network: FLUXNET


Geostationary surface albedo (GSA) data


“+000”


“+057/+063”


Landcover information (based on ESA CCI landcover data)


Landcover fractions @ 2km distance


Landcover fractions @ 20 km distance


Legend


Distance to open water bodies [km]:

4.16

Distance to urban areas [km]:

none in region


Radius: 1 km

Number of landcover classes:

1

Dominant landcover type:

70: Tree cover, needleleaved, evergreen, closed to open (>15%)

Fraction of dominant landcover type [%]:

100.0


Radius: 2 km

Number of landcover classes:

1

Dominant landcover type:

70: Tree cover, needleleaved, evergreen, closed to open (>15%)

Fraction of dominant landcover type [%]:

99.0


Radius: 5 km

Number of landcover classes:

2

Dominant landcover type:

70: Tree cover, needleleaved, evergreen, closed to open (>15%)

Fraction of dominant landcover type [%]:

95.0


Radius: 10 km

Number of landcover classes:

4

Dominant landcover type:

70: Tree cover, needleleaved, evergreen, closed to open (>15%)

Fraction of dominant landcover type [%]:

82.0


Radius: 20 km

Number of landcover classes:

6

Dominant landcover type:

70: Tree cover, needleleaved, evergreen, closed to open (>15%)

Fraction of dominant landcover type [%]:

83.0


Disturbances


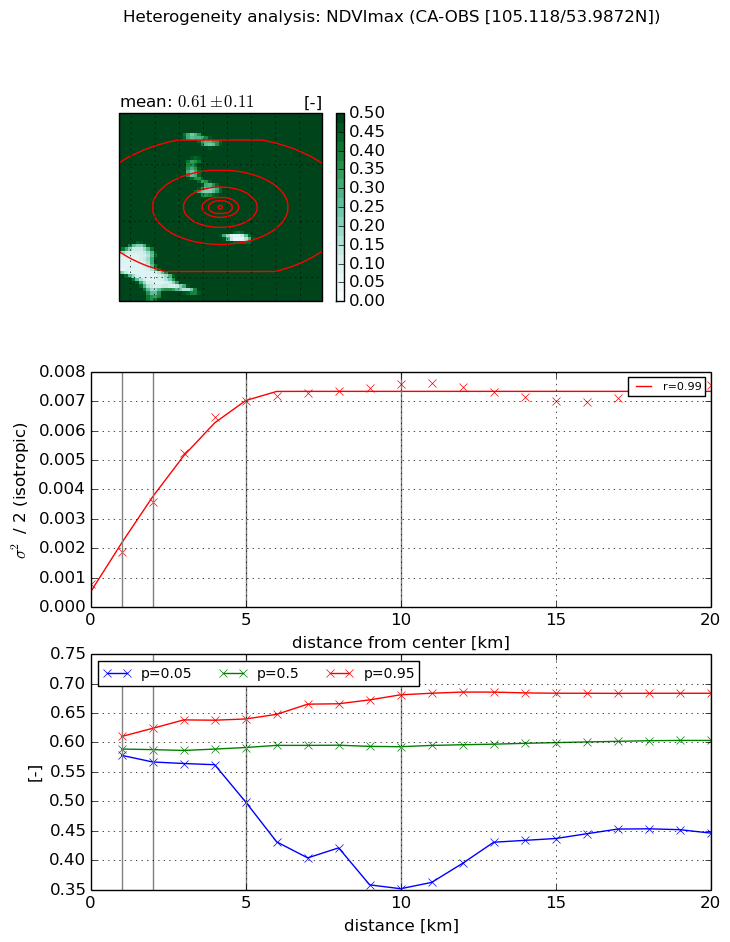
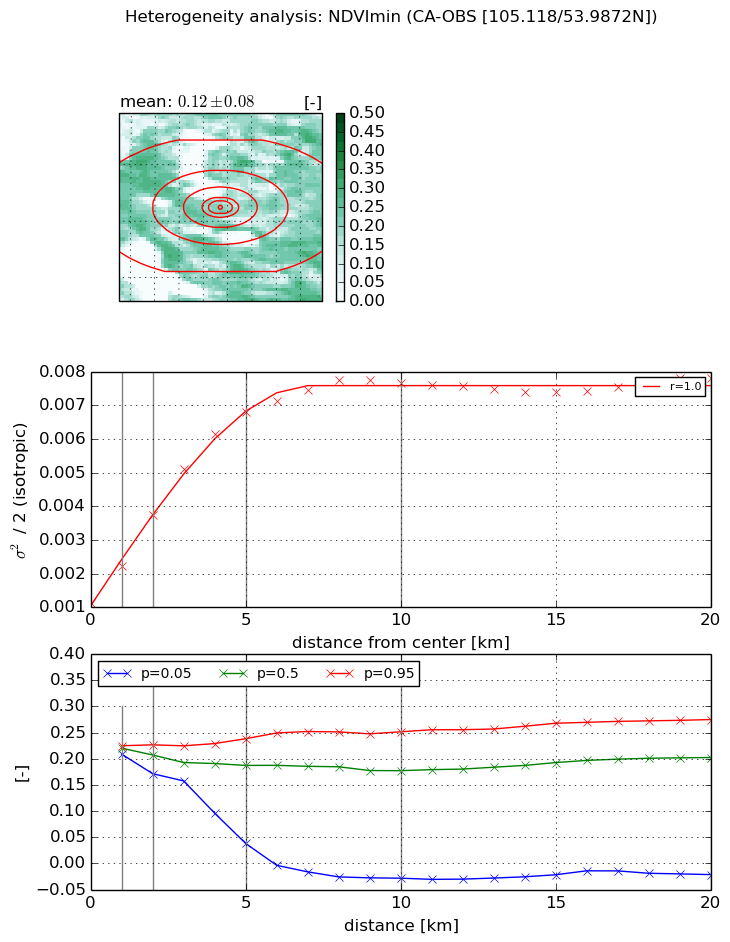
Heterogeneity analysis

The heterogeneity analysis provides information about the spatial and temporal heterogeneity of the site.

Topography


Roman et al. (2009) index


St

6.8599385458e-18

Rcv

0.0689114860893

Rse

0.0

Rst

-0.0102616443558

Rsv

4.37321701933e+17


Height range @ 1km [m]

6

Height range @ 2km [m]

36

Height range @ 5km [m]

67

Height range @ 10km [m]

-999

Height range @ 20km [m]

-999


Variance slope @ 1 km

104

Variance slope @ 2 km

120

Variance slope @ 5 km

83

Variance slope @ 10 km

-999

Variance slope @ 20 km

-999


NDVI (max. NDVI composite)


Roman et al. (2009) index


St

nan

Rcv

nan

Rse

nan

Rst

nan

Rsv

nan


NDVI range @ 1km [-]

0.03

NDVI range @ 2km [-]

0.06

NDVI range @ 5km [-]

0.14

NDVI range @ 10km [-]

0.33

NDVI range @ 20km [-]

0.24


Variance slope @ 1 km

0.00109176769085

Variance slope @ 2 km

0.00138531953256

Variance slope @ 5 km

0.00133099302525

Variance slope @ 10 km

0.000658168193624

Variance slope @ 20 km

0.000215200376437


NDVI (min. NDVI composite)I


Roman et al. (2009) index


St

0.624841460033

Rcv

2.39693574027

Rse

0.0

Rst

-0.181521307596

Rsv

2.22276084801


NDVI range @ 1km [-]

0.02

NDVI range @ 2km [-]

0.06

NDVI range @ 5km [-]

0.2

NDVI range @ 10km [-]

0.28

NDVI range @ 20km [-]

0.3


NDVI slope @ 1 km

0.00110589513253

NDVI slope @ 2 km

0.00130281121046

NDVI slope @ 5 km

0.00118431678728

NDVI slope @ 10 km

0.000659218099782

NDVI slope @ 20 km

0.000230583991377


Temporal stability analysis

+000 deg (BHR)


BHR statistics

Temporal stability [1/decade]:


abs

rel


Weighted least square:

None


Ordinary least square:

None


Probabilities that GCOS criteria is met:

Weighted least square:

None %

Ordinary least square:

None %


DHR statistics

Temporal stability [1/decade]:


abs

rel


Weighted least square:

None


Ordinary least square:

None


Probabilities that GCOS criteria is met:

Weighted least square:

None %

Ordinary least square:

None %


+057/+063 deg (BHR)


BHR statistics

Temporal stability [1/decade]:


abs

rel


Weighted least square:

None


Ordinary least square:

None


Probabilities that GCOS criteria is met:

Weighted least square:

None %

Ordinary least square:

None %


DHR statistics

Temporal stability [1/decade]:


abs

rel


Weighted least square:

None


Ordinary least square:

None


Probabilities that GCOS criteria is met:

Weighted least square:

None %

Ordinary least square:

None %


Temporal anomaly analyis

The variance of the temporal anomalies provides an additional measure about the stability of the signal AFTER removal of the mean seasonal cylce.

+000 deg


+057/+063 deg


By continuing to use this website, you are giving consent to analytic cookies being used. For more information on how EUMETSAT uses data and how you can disable this, please view this web page: Analytics Cookie Policy