CA-QCU


Location

lon / lat [deg]: -74.0365 / 49.2671

Source network: FLUXNET


Geostationary surface albedo (GSA) data


“+000”


“+057/+063”


Landcover information (based on ESA CCI landcover data)


Landcover fractions @ 2km distance


Landcover fractions @ 20 km distance


Legend


Distance to open water bodies [km]:

1.43

Distance to urban areas [km]:

none in region


Radius: 1 km

Number of landcover classes:

4

Dominant landcover type:

70: Tree cover, needleleaved, evergreen, closed to open (>15%)

Fraction of dominant landcover type [%]:

50.0


Radius: 2 km

Number of landcover classes:

9

Dominant landcover type:

70: Tree cover, needleleaved, evergreen, closed to open (>15%)

Fraction of dominant landcover type [%]:

43.0


Radius: 5 km

Number of landcover classes:

9

Dominant landcover type:

70: Tree cover, needleleaved, evergreen, closed to open (>15%)

Fraction of dominant landcover type [%]:

46.0


Radius: 10 km

Number of landcover classes:

9

Dominant landcover type:

70: Tree cover, needleleaved, evergreen, closed to open (>15%)

Fraction of dominant landcover type [%]:

53.0


Radius: 20 km

Number of landcover classes:

6

Dominant landcover type:

70: Tree cover, needleleaved, evergreen, closed to open (>15%)

Fraction of dominant landcover type [%]:

62.0


Disturbances


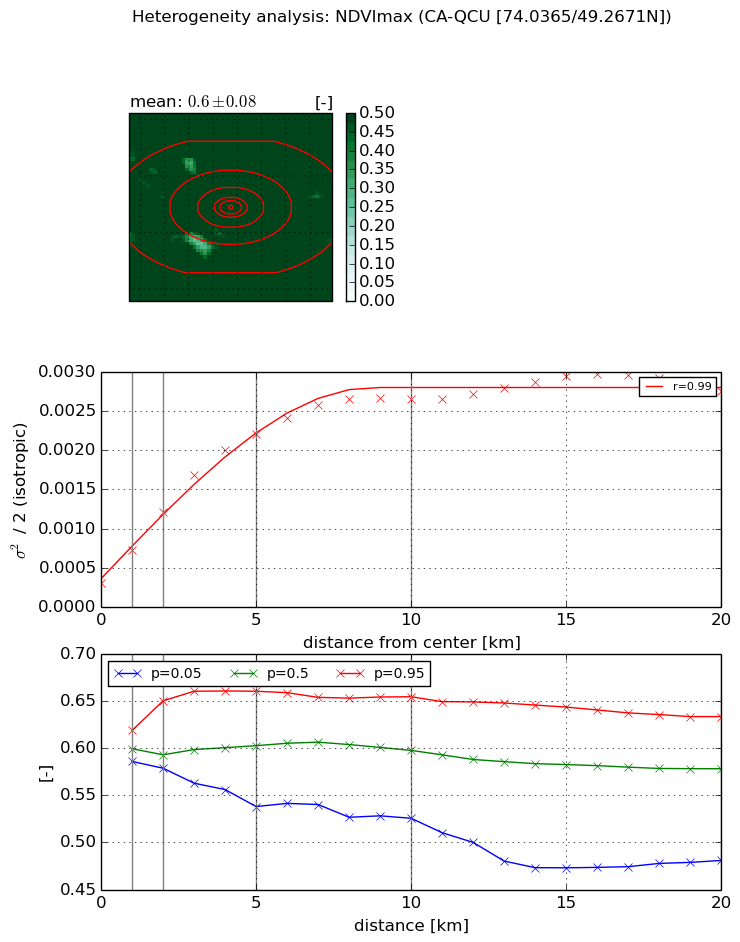
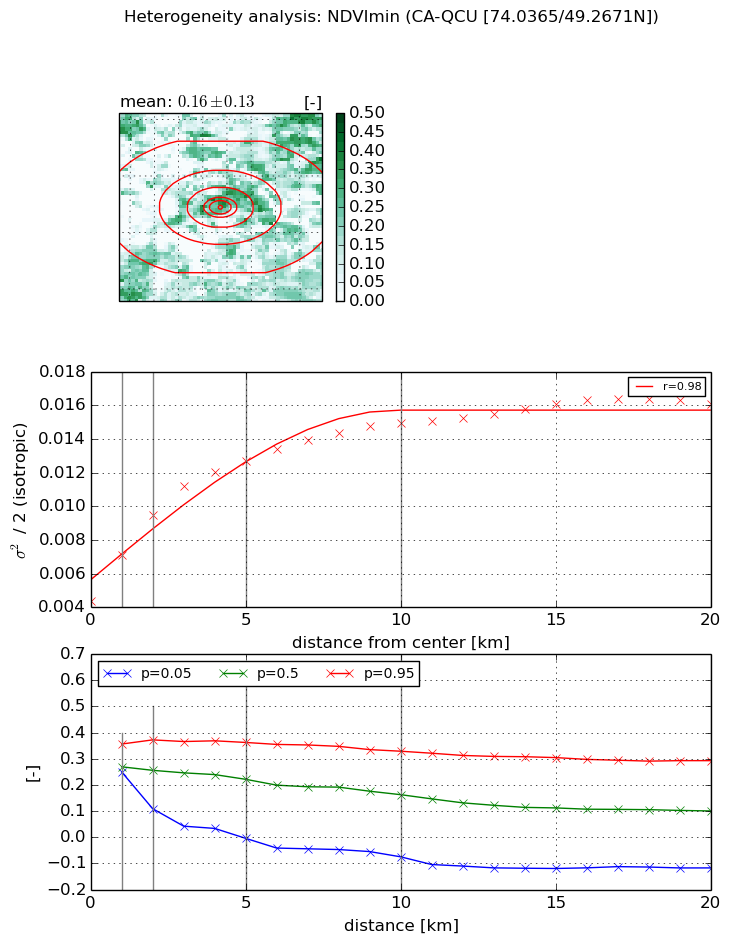
Heterogeneity analysis

The heterogeneity analysis provides information about the spatial and temporal heterogeneity of the site.

Topography


Roman et al. (2009) index


St

5.53941075388e-06

Rcv

0.0157397647551

Rse

0.0

Rst

-0.0478560572288

Rsv

541573.784832


Height range @ 1km [m]

24

Height range @ 2km [m]

35

Height range @ 5km [m]

46

Height range @ 10km [m]

-999

Height range @ 20km [m]

-999


Variance slope @ 1 km

86

Variance slope @ 2 km

66

Variance slope @ 5 km

37

Variance slope @ 10 km

-999

Variance slope @ 20 km

-999


NDVI (max. NDVI composite)


Roman et al. (2009) index


St

0.378454640175

Rcv

0.132708423868

Rse

0.0

Rst

0.0917593582611

Rsv

7.70250597253


NDVI range @ 1km [-]

0.03

NDVI range @ 2km [-]

0.07

NDVI range @ 5km [-]

0.12

NDVI range @ 10km [-]

0.13

NDVI range @ 20km [-]

0.15


Variance slope @ 1 km

0.00041166572357

Variance slope @ 2 km

0.000453265907054

Variance slope @ 5 km

0.000394345483735

Variance slope @ 10 km

0.000236122211605

Variance slope @ 20 km

0.00010144649327


NDVI (min. NDVI composite)I


Roman et al. (2009) index


St

4.29871060087

Rcv

0.28905861105

Rse

0.0

Rst

-0.0450835231863

Rsv

0.363741551954


NDVI range @ 1km [-]

0.11

NDVI range @ 2km [-]

0.26

NDVI range @ 5km [-]

0.37

NDVI range @ 10km [-]

0.4

NDVI range @ 20km [-]

0.41


NDVI slope @ 1 km

0.00270863975639

NDVI slope @ 2 km

0.00255594580986

NDVI slope @ 5 km

0.00166525452736

NDVI slope @ 10 km

0.00095648180684

NDVI slope @ 20 km

0.000455486518223


Temporal stability analysis

+000 deg (BHR)


BHR statistics

Temporal stability [1/decade]:


abs

rel


Weighted least square:

-99999.0


Ordinary least square:

-99999.0


Probabilities that GCOS criteria is met:

Weighted least square:

-99999.0 %

Ordinary least square:

-99999.0 %


DHR statistics

Temporal stability [1/decade]:


abs

rel


Weighted least square:

-99999.0


Ordinary least square:

-99999.0


Probabilities that GCOS criteria is met:

Weighted least square:

-99999.0 %

Ordinary least square:

-99999.0 %


+057/+063 deg (BHR)


BHR statistics

Temporal stability [1/decade]:


abs

rel


Weighted least square:

None


Ordinary least square:

None


Probabilities that GCOS criteria is met:

Weighted least square:

None %

Ordinary least square:

None %


DHR statistics

Temporal stability [1/decade]:


abs

rel


Weighted least square:

None


Ordinary least square:

None


Probabilities that GCOS criteria is met:

Weighted least square:

None %

Ordinary least square:

None %


Temporal anomaly analyis

The variance of the temporal anomalies provides an additional measure about the stability of the signal AFTER removal of the mean seasonal cylce.

+000 deg


+057/+063 deg