CA-SF2


Location

lon / lat [deg]: -105.878 / 54.2539

Source network: FLUXNET


Geostationary surface albedo (GSA) data


“+000”


“+057/+063”


Landcover information (based on ESA CCI landcover data)


Landcover fractions @ 2km distance


Landcover fractions @ 20 km distance


Legend


Distance to open water bodies [km]:

0.99

Distance to urban areas [km]:

38.47


Radius: 1 km

Number of landcover classes:

6

Dominant landcover type:

62: Tree cover, broadleaved, decidous (open 15-40%)

Fraction of dominant landcover type [%]:

33.0


Radius: 2 km

Number of landcover classes:

8

Dominant landcover type:

100: Mosaic tree and shrub (>50%) / herbaceous cover (<50%)

Fraction of dominant landcover type [%]:

36.0


Radius: 5 km

Number of landcover classes:

8

Dominant landcover type:

70: Tree cover, needleleaved, evergreen, closed to open (>15%)

Fraction of dominant landcover type [%]:

43.0


Radius: 10 km

Number of landcover classes:

7

Dominant landcover type:

70: Tree cover, needleleaved, evergreen, closed to open (>15%)

Fraction of dominant landcover type [%]:

47.0


Radius: 20 km

Number of landcover classes:

7

Dominant landcover type:

70: Tree cover, needleleaved, evergreen, closed to open (>15%)

Fraction of dominant landcover type [%]:

59.0


Disturbances


Heterogeneity analysis

The heterogeneity analysis provides information about the spatial and temporal heterogeneity of the site.

Topography


Roman et al. (2009) index


St

0.122986252642

Rcv

0.68158830849

Rse

0.0

Rst

2.83480366454e-05

Rsv

23.7113535784


Height range @ 1km [m]

21

Height range @ 2km [m]

27

Height range @ 5km [m]

52

Height range @ 10km [m]

-999

Height range @ 20km [m]

-999


Variance slope @ 1 km

30

Variance slope @ 2 km

38

Variance slope @ 5 km

57

Variance slope @ 10 km

-999

Variance slope @ 20 km

-999


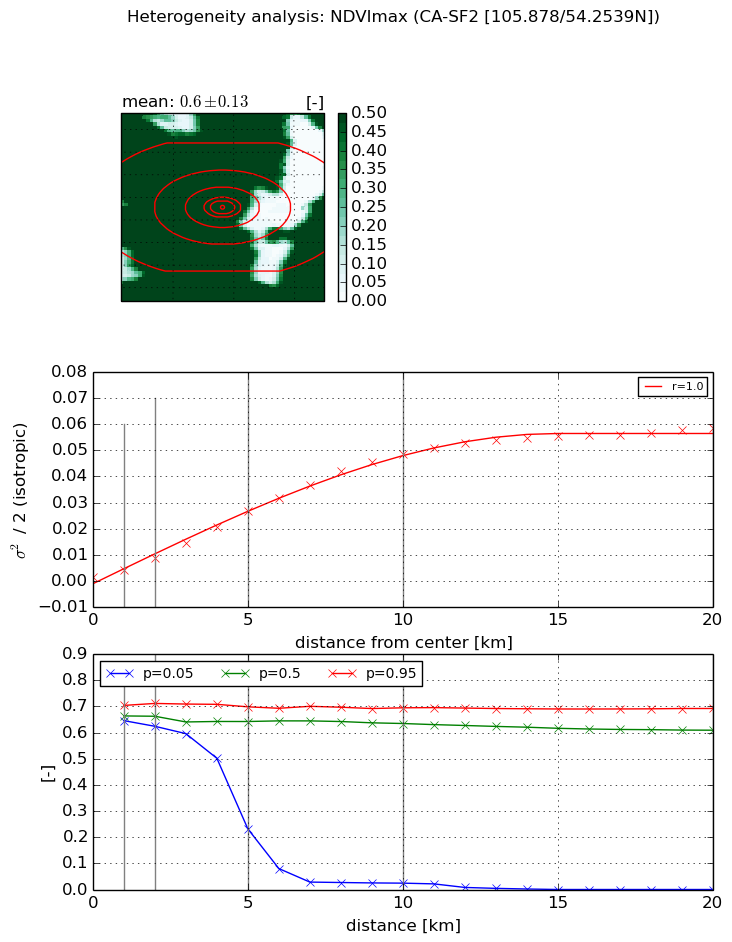
NDVI (max. NDVI composite)


Roman et al. (2009) index


St

0.710858202318

Rcv

2.94839087109

Rse

0.0

Rst

-0.271860447976

Rsv

-0.999999625804


NDVI range @ 1km [-]

0.06

NDVI range @ 2km [-]

0.09

NDVI range @ 5km [-]

0.47

NDVI range @ 10km [-]

0.67

NDVI range @ 20km [-]

0.69


Variance slope @ 1 km

0.00280062992045

Variance slope @ 2 km

0.00373365494526

Variance slope @ 5 km

0.00520221753614

Variance slope @ 10 km

0.00504861342357

Variance slope @ 20 km

0.00292388086965


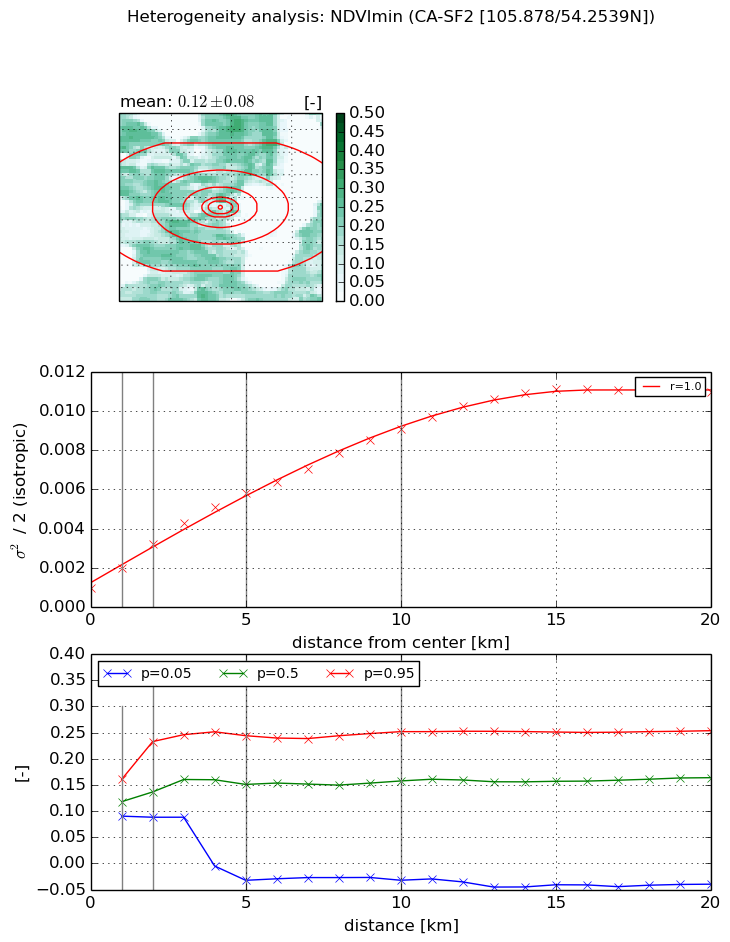
NDVI (min. NDVI composite)I


Roman et al. (2009) index


St

0.546803201207

Rcv

1.07191933599

Rse

0.0

Rst

-0.360512383985

Rsv

4.05400287548


NDVI range @ 1km [-]

0.07

NDVI range @ 2km [-]

0.14

NDVI range @ 5km [-]

0.28

NDVI range @ 10km [-]

0.28

NDVI range @ 20km [-]

0.29


NDVI slope @ 1 km

0.00101194810939

NDVI slope @ 2 km

0.00112885432532

NDVI slope @ 5 km

0.0009886305234

NDVI slope @ 10 km

0.000793970660126

NDVI slope @ 20 km

0.00050491703298


Temporal stability analysis

+000 deg (BHR)


BHR statistics

Temporal stability [1/decade]:


abs

rel


Weighted least square:

None


Ordinary least square:

None


Probabilities that GCOS criteria is met:

Weighted least square:

None %

Ordinary least square:

None %


DHR statistics

Temporal stability [1/decade]:


abs

rel


Weighted least square:

None


Ordinary least square:

None


Probabilities that GCOS criteria is met:

Weighted least square:

None %

Ordinary least square:

None %


+057/+063 deg (BHR)


BHR statistics

Temporal stability [1/decade]:


abs

rel


Weighted least square:

None


Ordinary least square:

None


Probabilities that GCOS criteria is met:

Weighted least square:

None %

Ordinary least square:

None %


DHR statistics

Temporal stability [1/decade]:


abs

rel


Weighted least square:

None


Ordinary least square:

None


Probabilities that GCOS criteria is met:

Weighted least square:

None %

Ordinary least square:

None %


Temporal anomaly analyis

The variance of the temporal anomalies provides an additional measure about the stability of the signal AFTER removal of the mean seasonal cylce.

+000 deg


+057/+063 deg