CA-TP2


Location

lon / lat [deg]: -80.4588 / 42.7744

Source network: FLUXNET


Geostationary surface albedo (GSA) data


“+000”


“+057/+063”


Landcover information (based on ESA CCI landcover data)


Landcover fractions @ 2km distance


Landcover fractions @ 20 km distance


Legend


Distance to open water bodies [km]:

12.98

Distance to urban areas [km]:

7.71


Radius: 1 km

Number of landcover classes:

3

Dominant landcover type:

62: Tree cover, broadleaved, decidous (open 15-40%)

Fraction of dominant landcover type [%]:

64.0


Radius: 2 km

Number of landcover classes:

5

Dominant landcover type:

10: cropland, rainfed

Fraction of dominant landcover type [%]:

62.0


Radius: 5 km

Number of landcover classes:

5

Dominant landcover type:

10: cropland, rainfed

Fraction of dominant landcover type [%]:

74.0


Radius: 10 km

Number of landcover classes:

5

Dominant landcover type:

10: cropland, rainfed

Fraction of dominant landcover type [%]:

73.0


Radius: 20 km

Number of landcover classes:

7

Dominant landcover type:

10: cropland, rainfed

Fraction of dominant landcover type [%]:

67.0


Disturbances


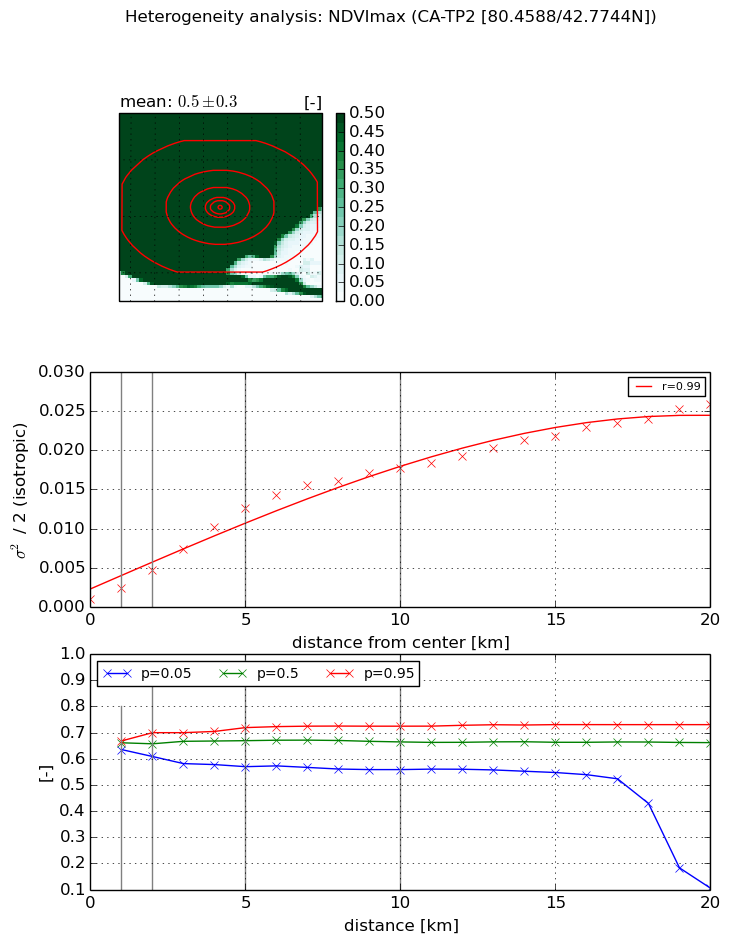
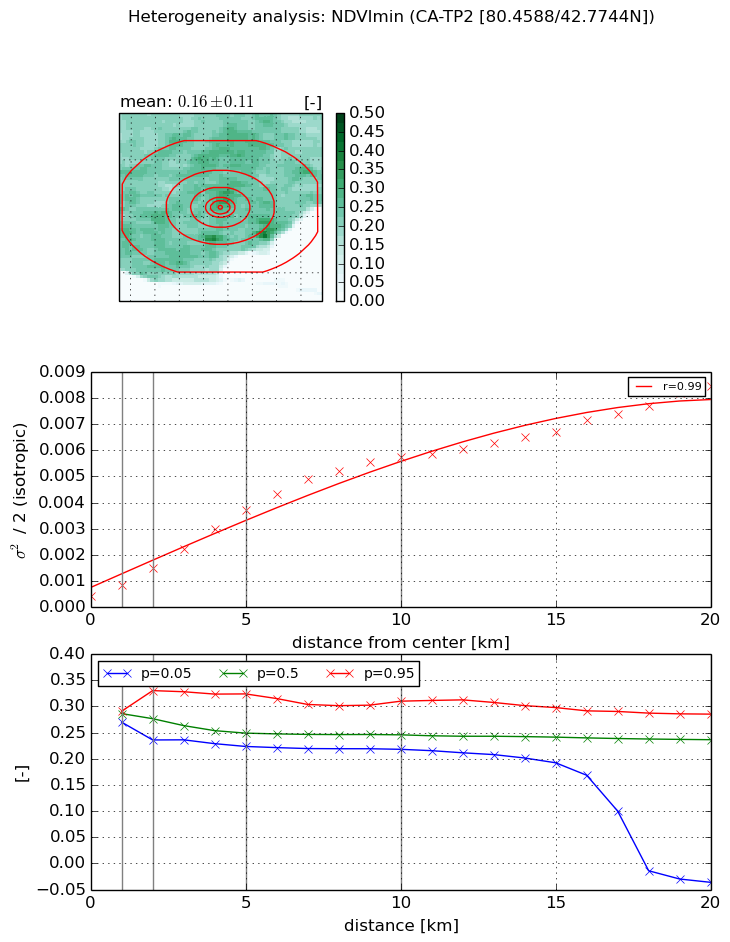
Heterogeneity analysis

The heterogeneity analysis provides information about the spatial and temporal heterogeneity of the site.

Topography


Roman et al. (2009) index


St

2.21415761398

Rcv

0.363009066467

Rse

0.0

Rst

1.87651417605e-07

Rsv

-0.991907839885


Height range @ 1km [m]

21

Height range @ 2km [m]

22

Height range @ 5km [m]

36

Height range @ 10km [m]

-999

Height range @ 20km [m]

-999


Variance slope @ 1 km

32

Variance slope @ 2 km

23

Variance slope @ 5 km

20

Variance slope @ 10 km

-999

Variance slope @ 20 km

-999


NDVI (max. NDVI composite)


Roman et al. (2009) index


St

2.16759436161

Rcv

0.249216315791

Rse

0.0

Rst

-0.134810418817

Rsv

-0.99999605726


NDVI range @ 1km [-]

0.03

NDVI range @ 2km [-]

0.09

NDVI range @ 5km [-]

0.15

NDVI range @ 10km [-]

0.17

NDVI range @ 20km [-]

0.63


Variance slope @ 1 km

0.00136489798758

Variance slope @ 2 km

0.00186439095147

Variance slope @ 5 km

0.00241087860058

Variance slope @ 10 km

0.00178722532591

Variance slope @ 20 km

0.00115876882047


NDVI (min. NDVI composite)I


Roman et al. (2009) index


St

13.7428029732

Rcv

-0.0286216301332

Rse

0.0

Rst

-0.0261412328667

Rsv

0.163533215743


NDVI range @ 1km [-]

0.02

NDVI range @ 2km [-]

0.09

NDVI range @ 5km [-]

0.1

NDVI range @ 10km [-]

0.09

NDVI range @ 20km [-]

0.32


NDVI slope @ 1 km

0.000415800939286

NDVI slope @ 2 km

0.000539004542505

NDVI slope @ 5 km

0.000672199923462

NDVI slope @ 10 km

0.000574137393296

NDVI slope @ 20 km

0.000373430332293


Temporal stability analysis

+000 deg (BHR)


BHR statistics

Temporal stability [1/decade]:


abs

rel


Weighted least square:

None


Ordinary least square:

None


Probabilities that GCOS criteria is met:

Weighted least square:

None %

Ordinary least square:

None %


DHR statistics

Temporal stability [1/decade]:


abs

rel


Weighted least square:

None


Ordinary least square:

None


Probabilities that GCOS criteria is met:

Weighted least square:

None %

Ordinary least square:

None %


+057/+063 deg (BHR)


BHR statistics

Temporal stability [1/decade]:


abs

rel


Weighted least square:

None


Ordinary least square:

None


Probabilities that GCOS criteria is met:

Weighted least square:

None %

Ordinary least square:

None %


DHR statistics

Temporal stability [1/decade]:


abs

rel


Weighted least square:

None


Ordinary least square:

None


Probabilities that GCOS criteria is met:

Weighted least square:

None %

Ordinary least square:

None %


Temporal anomaly analyis

The variance of the temporal anomalies provides an additional measure about the stability of the signal AFTER removal of the mean seasonal cylce.

+000 deg


+057/+063 deg