CA-TP4


Location

lon / lat [deg]: -80.3574 / 42.7098

Source network: FLUXNET


Geostationary surface albedo (GSA) data


“+000”


“+057/+063”


Landcover information (based on ESA CCI landcover data)


Landcover fractions @ 2km distance


Landcover fractions @ 20 km distance


Legend


Distance to open water bodies [km]:

2.79

Distance to urban areas [km]:

13.2


Radius: 1 km

Number of landcover classes:

5

Dominant landcover type:

71: Tree cover, needleleaved, evergreen, closed to open (>40%)

Fraction of dominant landcover type [%]:

40.0


Radius: 2 km

Number of landcover classes:

9

Dominant landcover type:

10: cropland, rainfed

Fraction of dominant landcover type [%]:

31.0


Radius: 5 km

Number of landcover classes:

8

Dominant landcover type:

10: cropland, rainfed

Fraction of dominant landcover type [%]:

47.0


Radius: 10 km

Number of landcover classes:

5

Dominant landcover type:

10: cropland, rainfed

Fraction of dominant landcover type [%]:

43.0


Radius: 20 km

Number of landcover classes:

7

Dominant landcover type:

10: cropland, rainfed

Fraction of dominant landcover type [%]:

42.0


Disturbances


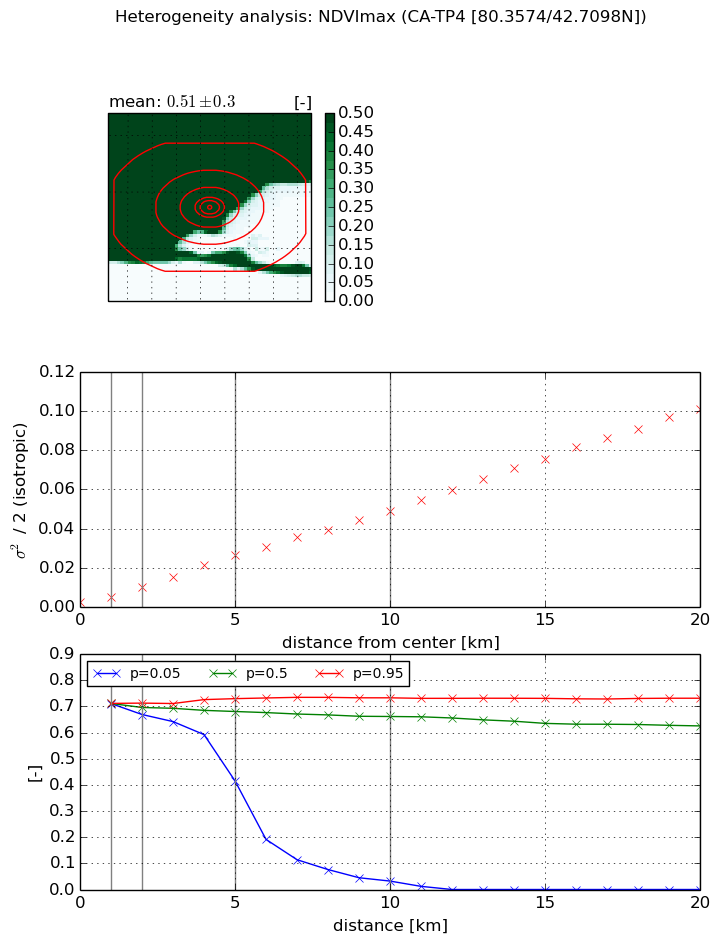
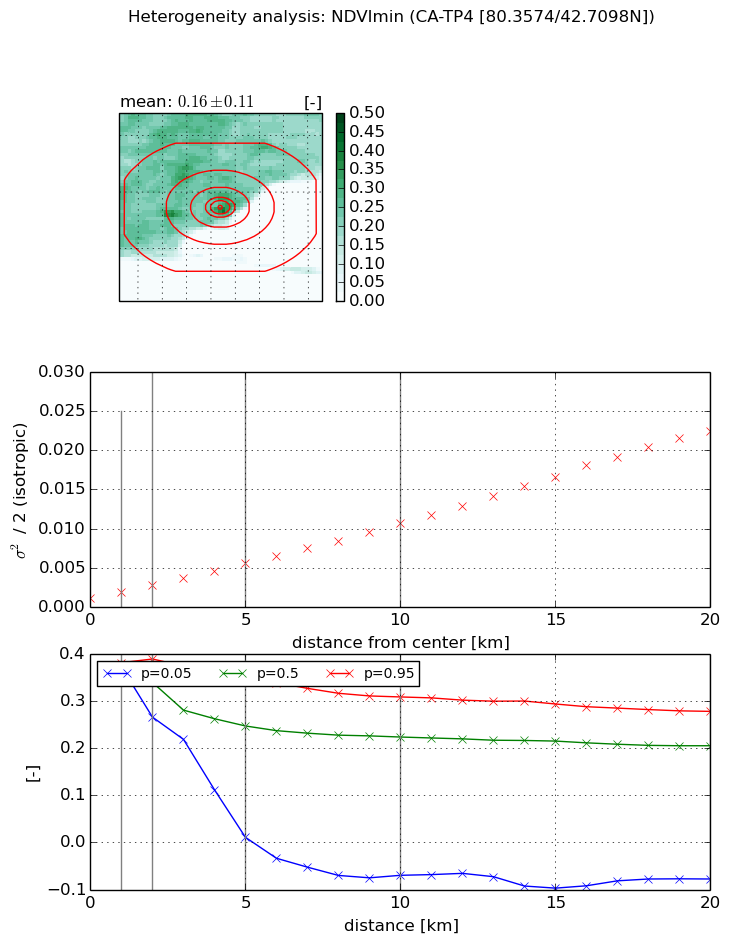
Heterogeneity analysis

The heterogeneity analysis provides information about the spatial and temporal heterogeneity of the site.

Topography


Roman et al. (2009) index


St

0.0037309049971

Rcv

0.864352452321

Rse

0.0

Rst

0.0150866371467

Rsv

803.215010469


Height range @ 1km [m]

15

Height range @ 2km [m]

20

Height range @ 5km [m]

59

Height range @ 10km [m]

-999

Height range @ 20km [m]

-999


Variance slope @ 1 km

65

Variance slope @ 2 km

72

Variance slope @ 5 km

84

Variance slope @ 10 km

-999

Variance slope @ 20 km

-999


NDVI (max. NDVI composite)


Roman et al. (2009) index


St

0.54003871189

Rcv

3.86257041948

Rse

0.0

Rst

-0.692588540243

Rsv

-0.999998353915


NDVI range @ 1km [-]

0.0

NDVI range @ 2km [-]

0.04

NDVI range @ 5km [-]

0.31

NDVI range @ 10km [-]

0.7

NDVI range @ 20km [-]

0.73


Variance slope @ 1 km

0.0028001462924

Variance slope @ 2 km

0.00382569554707

Variance slope @ 5 km

0.00501116713787

Variance slope @ 10 km

0.00479431935739

Variance slope @ 20 km

0.00501695199797


NDVI (min. NDVI composite)I


Roman et al. (2009) index


St

0.544945603397

Rcv

1.35667998746

Rse

0.0

Rst

-0.428328937833

Rsv

3.7201276999


NDVI range @ 1km [-]

0.01

NDVI range @ 2km [-]

0.12

NDVI range @ 5km [-]

0.33

NDVI range @ 10km [-]

0.38

NDVI range @ 20km [-]

0.36


NDVI slope @ 1 km

0.000765047939832

NDVI slope @ 2 km

0.000833696603042

NDVI slope @ 5 km

0.000888977056533

NDVI slope @ 10 km

0.00095837698228

NDVI slope @ 20 km

0.00109192149756


Temporal stability analysis

+000 deg (BHR)


BHR statistics

Temporal stability [1/decade]:


abs

rel


Weighted least square:

None


Ordinary least square:

None


Probabilities that GCOS criteria is met:

Weighted least square:

None %

Ordinary least square:

None %


DHR statistics

Temporal stability [1/decade]:


abs

rel


Weighted least square:

None


Ordinary least square:

None


Probabilities that GCOS criteria is met:

Weighted least square:

None %

Ordinary least square:

None %


+057/+063 deg (BHR)


BHR statistics

Temporal stability [1/decade]:


abs

rel


Weighted least square:

None


Ordinary least square:

None


Probabilities that GCOS criteria is met:

Weighted least square:

None %

Ordinary least square:

None %


DHR statistics

Temporal stability [1/decade]:


abs

rel


Weighted least square:

None


Ordinary least square:

None


Probabilities that GCOS criteria is met:

Weighted least square:

None %

Ordinary least square:

None %


Temporal anomaly analyis

The variance of the temporal anomalies provides an additional measure about the stability of the signal AFTER removal of the mean seasonal cylce.

+000 deg


+057/+063 deg