CA-WP1


Location

lon / lat [deg]: -112.467 / 54.9538

Source network: FLUXNET


Geostationary surface albedo (GSA) data


“+000”


“+057/+063”


Landcover information (based on ESA CCI landcover data)


Landcover fractions @ 2km distance


Landcover fractions @ 20 km distance


Legend


Distance to open water bodies [km]:

7.72

Distance to urban areas [km]:

36.95


Radius: 1 km

Number of landcover classes:

3

Dominant landcover type:

70: Tree cover, needleleaved, evergreen, closed to open (>15%)

Fraction of dominant landcover type [%]:

68.0


Radius: 2 km

Number of landcover classes:

5

Dominant landcover type:

70: Tree cover, needleleaved, evergreen, closed to open (>15%)

Fraction of dominant landcover type [%]:

75.0


Radius: 5 km

Number of landcover classes:

7

Dominant landcover type:

70: Tree cover, needleleaved, evergreen, closed to open (>15%)

Fraction of dominant landcover type [%]:

52.0


Radius: 10 km

Number of landcover classes:

9

Dominant landcover type:

70: Tree cover, needleleaved, evergreen, closed to open (>15%)

Fraction of dominant landcover type [%]:

41.0


Radius: 20 km

Number of landcover classes:

10

Dominant landcover type:

70: Tree cover, needleleaved, evergreen, closed to open (>15%)

Fraction of dominant landcover type [%]:

32.0


Disturbances


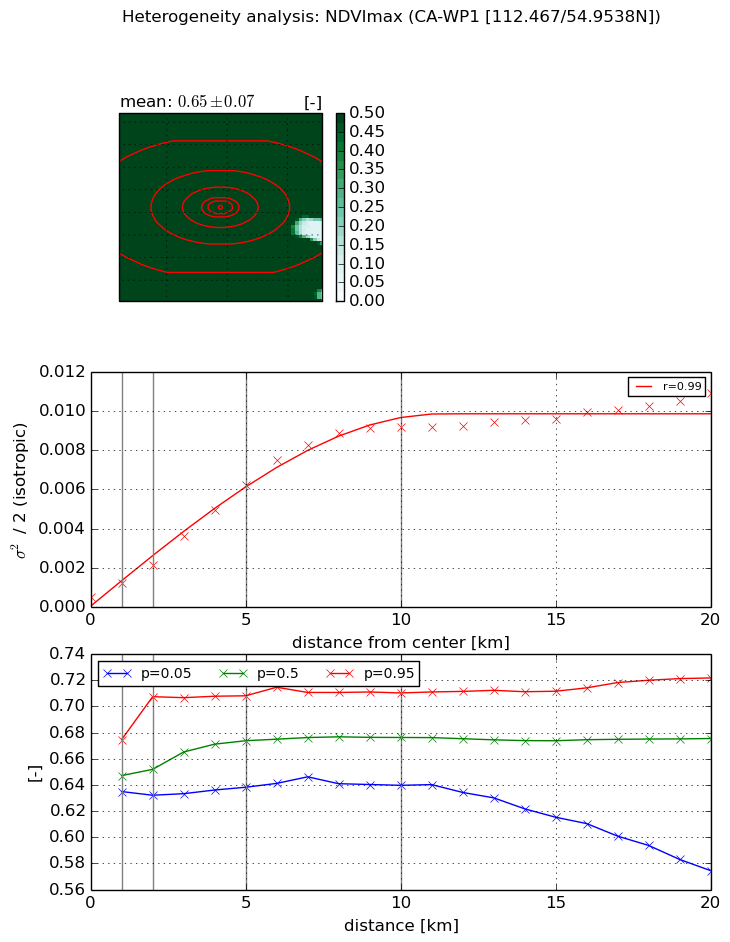
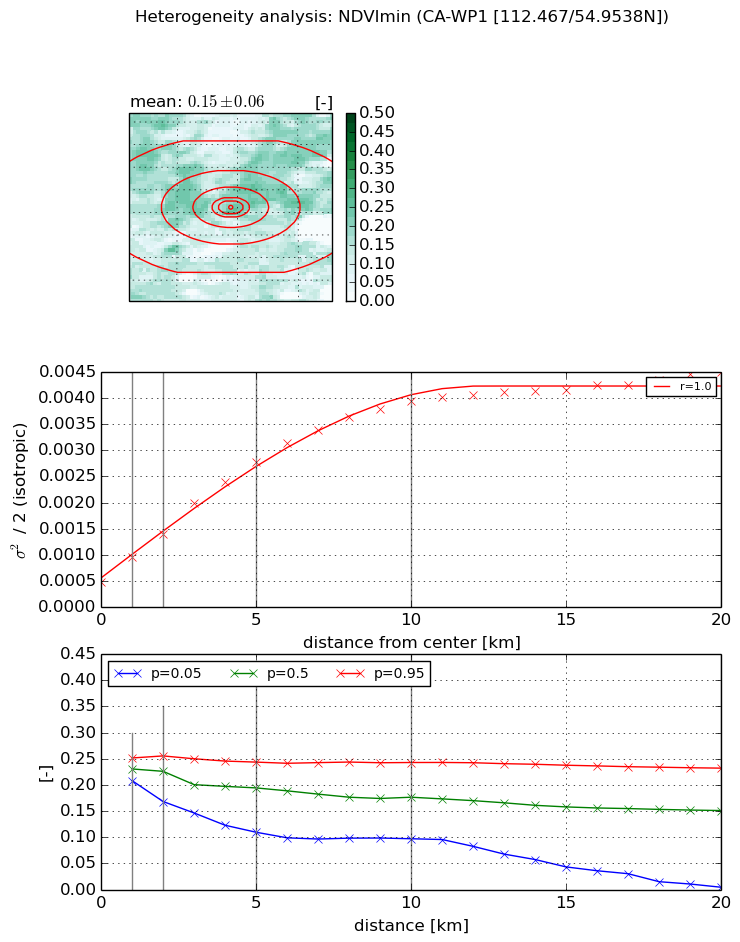
Heterogeneity analysis

The heterogeneity analysis provides information about the spatial and temporal heterogeneity of the site.

Topography


Roman et al. (2009) index


St

0.00080488781804

Rcv

0.430108002866

Rse

0.0

Rst

-0.000906942351906

Rsv

3726.79647286


Height range @ 1km [m]

5

Height range @ 2km [m]

13

Height range @ 5km [m]

27

Height range @ 10km [m]

-999

Height range @ 20km [m]

-999


Variance slope @ 1 km

24

Variance slope @ 2 km

26

Variance slope @ 5 km

21

Variance slope @ 10 km

-999

Variance slope @ 20 km

-999


NDVI (max. NDVI composite)


Roman et al. (2009) index


St

7.7791183922

Rcv

-0.0857048113506

Rse

0.0

Rst

-0.0771657072304

Rsv

0.222777295059


NDVI range @ 1km [-]

0.04

NDVI range @ 2km [-]

0.08

NDVI range @ 5km [-]

0.07

NDVI range @ 10km [-]

0.07

NDVI range @ 20km [-]

0.15


Variance slope @ 1 km

0.000717993928205

Variance slope @ 2 km

0.000822270051298

Variance slope @ 5 km

0.00118511683406

Variance slope @ 10 km

0.000973941134115

Variance slope @ 20 km

0.000463768896926


NDVI (min. NDVI composite)I


Roman et al. (2009) index


St

1.26372295169

Rcv

0.341203663096

Rse

0.0

Rst

-0.24678475445

Rsv

1.78594963271


NDVI range @ 1km [-]

0.04

NDVI range @ 2km [-]

0.09

NDVI range @ 5km [-]

0.13

NDVI range @ 10km [-]

0.15

NDVI range @ 20km [-]

0.23


NDVI slope @ 1 km

0.00047290305627

NDVI slope @ 2 km

0.000459636841022

NDVI slope @ 5 km

0.000468170386306

NDVI slope @ 10 km

0.000352938511007

NDVI slope @ 20 km

0.000176888422521


Temporal stability analysis

+000 deg (BHR)


BHR statistics

Temporal stability [1/decade]:


abs

rel


Weighted least square:

None


Ordinary least square:

None


Probabilities that GCOS criteria is met:

Weighted least square:

None %

Ordinary least square:

None %


DHR statistics

Temporal stability [1/decade]:


abs

rel


Weighted least square:

None


Ordinary least square:

None


Probabilities that GCOS criteria is met:

Weighted least square:

None %

Ordinary least square:

None %


+057/+063 deg (BHR)


BHR statistics

Temporal stability [1/decade]:


abs

rel


Weighted least square:

None


Ordinary least square:

None


Probabilities that GCOS criteria is met:

Weighted least square:

None %

Ordinary least square:

None %


DHR statistics

Temporal stability [1/decade]:


abs

rel


Weighted least square:

None


Ordinary least square:

None


Probabilities that GCOS criteria is met:

Weighted least square:

None %

Ordinary least square:

None %


Temporal anomaly analyis

The variance of the temporal anomalies provides an additional measure about the stability of the signal AFTER removal of the mean seasonal cylce.

+000 deg


+057/+063 deg


By continuing to use this website, you are giving consent to analytic cookies being used. For more information on how EUMETSAT uses data and how you can disable this, please view this web page: Analytics Cookie Policy