CAB


Location

lon / lat [deg]: 4.9267 / 51.9711

Source network: BSRN


Geostationary surface albedo (GSA) data


“+000”


“+057/+063”


Landcover information (based on ESA CCI landcover data)


Landcover fractions @ 2km distance


Landcover fractions @ 20 km distance


Legend


Distance to open water bodies [km]:

0.85

Distance to urban areas [km]:

0.62


Radius: 1 km

Number of landcover classes:

3

Dominant landcover type:

130: grassland

Fraction of dominant landcover type [%]:

80.0


Radius: 2 km

Number of landcover classes:

5

Dominant landcover type:

130: grassland

Fraction of dominant landcover type [%]:

75.0


Radius: 5 km

Number of landcover classes:

4

Dominant landcover type:

130: grassland

Fraction of dominant landcover type [%]:

82.0


Radius: 10 km

Number of landcover classes:

5

Dominant landcover type:

130: grassland

Fraction of dominant landcover type [%]:

84.0


Radius: 20 km

Number of landcover classes:

6

Dominant landcover type:

130: grassland

Fraction of dominant landcover type [%]:

68.0


Disturbances


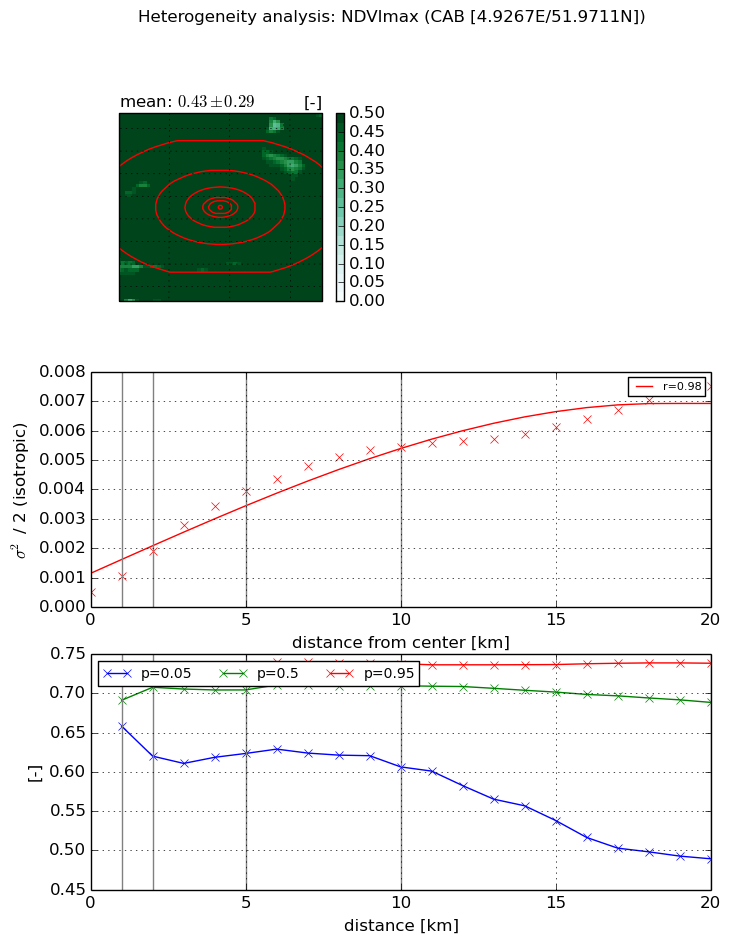
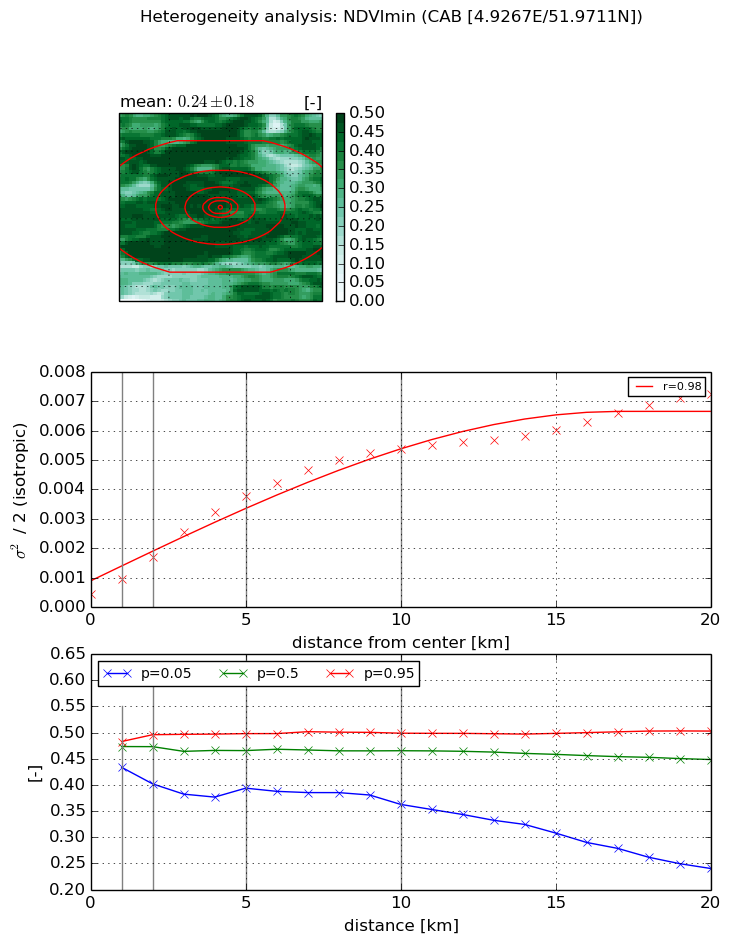
Heterogeneity analysis

The heterogeneity analysis provides information about the spatial and temporal heterogeneity of the site.

Topography


Roman et al. (2009) index


St

6.08833595705

Rcv

0.102540881669

Rse

0.0

Rst

0.116594837674

Rsv

-0.273609756787


Height range @ 1km [m]

3

Height range @ 2km [m]

4

Height range @ 5km [m]

4

Height range @ 10km [m]

-999

Height range @ 20km [m]

-999


Variance slope @ 1 km

1

Variance slope @ 2 km

0

Variance slope @ 5 km

0

Variance slope @ 10 km

-999

Variance slope @ 20 km

-999


NDVI (max. NDVI composite)


Roman et al. (2009) index


St

6.38202446915

Rcv

-0.108663424859

Rse

0.0

Rst

-0.109533057333

Rsv

0.251873793236


NDVI range @ 1km [-]

0.06

NDVI range @ 2km [-]

0.11

NDVI range @ 5km [-]

0.11

NDVI range @ 10km [-]

0.13

NDVI range @ 20km [-]

0.25


Variance slope @ 1 km

0.000567029353038

Variance slope @ 2 km

0.000698136066091

Variance slope @ 5 km

0.000722010568804

Variance slope @ 10 km

0.000513953572123

Variance slope @ 20 km

0.000303743822832


NDVI (min. NDVI composite)I


Roman et al. (2009) index


St

14.1587321191

Rcv

-0.061853011672

Rse

0.0

Rst

-0.0778513168409

Rsv

0.0721790502227


NDVI range @ 1km [-]

0.05

NDVI range @ 2km [-]

0.09

NDVI range @ 5km [-]

0.1

NDVI range @ 10km [-]

0.14

NDVI range @ 20km [-]

0.26


NDVI slope @ 1 km

0.000500828018044

NDVI slope @ 2 km

0.000634561150446

NDVI slope @ 5 km

0.000696692257419

NDVI slope @ 10 km

0.000516332791269

NDVI slope @ 20 km

0.000303215496586


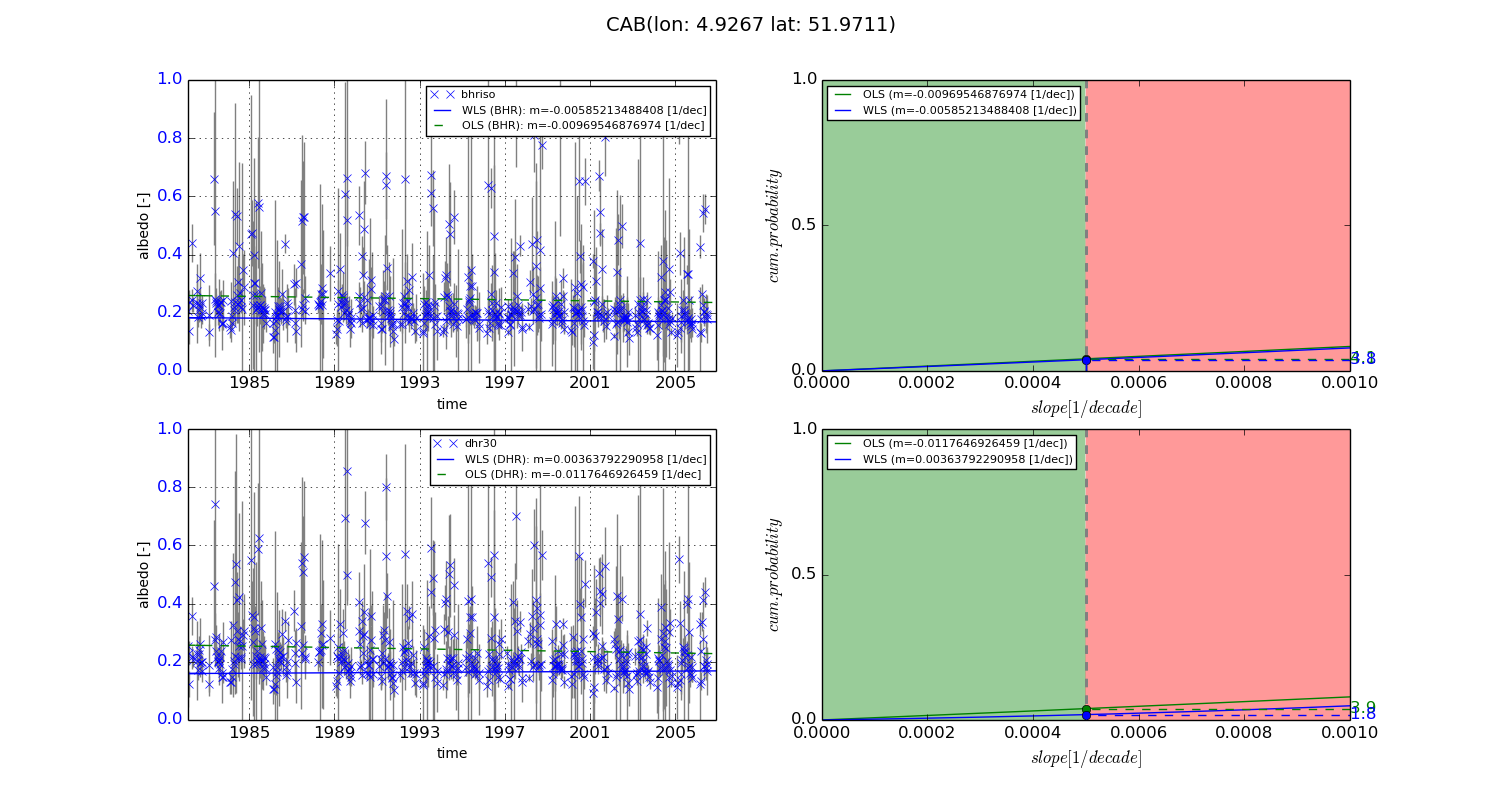
Temporal stability analysis

+000 deg (BHR)


BHR statistics

Temporal stability [1/decade]:


abs

rel


Weighted least square:

-0.00585213488408


Ordinary least square:

-0.00969546876974


Probabilities that GCOS criteria is met:

Weighted least square:

3.8 %

Ordinary least square:

4.1 %


DHR statistics

Temporal stability [1/decade]:


abs

rel


Weighted least square:

0.00363792290958


Ordinary least square:

-0.0117646926459


Probabilities that GCOS criteria is met:

Weighted least square:

1.8 %

Ordinary least square:

3.9 %


+057/+063 deg (BHR)


BHR statistics

Temporal stability [1/decade]:


abs

rel


Weighted least square:

-99999.0


Ordinary least square:

-99999.0


Probabilities that GCOS criteria is met:

Weighted least square:

-99999.0 %

Ordinary least square:

-99999.0 %


DHR statistics

Temporal stability [1/decade]:


abs

rel


Weighted least square:

-99999.0


Ordinary least square:

-99999.0


Probabilities that GCOS criteria is met:

Weighted least square:

-99999.0 %

Ordinary least square:

-99999.0 %


Temporal anomaly analyis

The variance of the temporal anomalies provides an additional measure about the stability of the signal AFTER removal of the mean seasonal cylce.
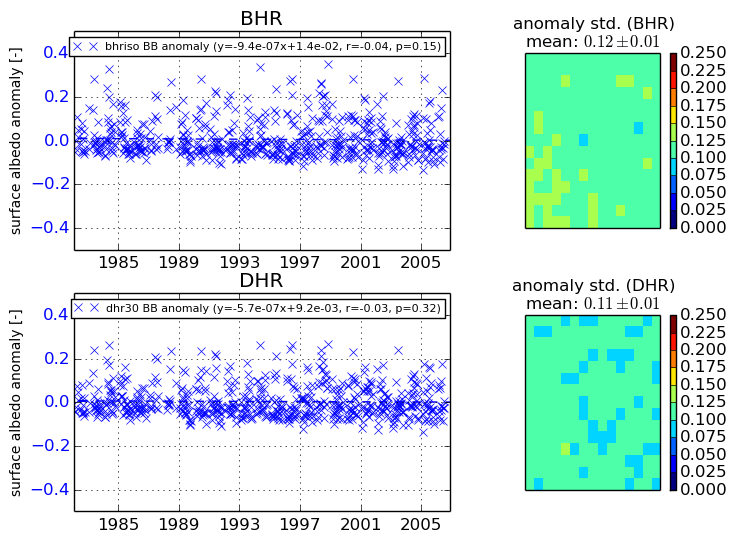
+000 deg


+057/+063 deg