CACERES


Location

lon / lat [deg]: -6.3435 / 39.4786

Source network: AERONET


Geostationary surface albedo (GSA) data


“+000”


“+057/+063”


Landcover information (based on ESA CCI landcover data)


Landcover fractions @ 2km distance


Landcover fractions @ 20 km distance


Legend


Distance to open water bodies [km]:

3.99

Distance to urban areas [km]:

0.07


Radius: 1 km

Number of landcover classes:

3

Dominant landcover type:

10: cropland, rainfed

Fraction of dominant landcover type [%]:

53.0


Radius: 2 km

Number of landcover classes:

7

Dominant landcover type:

10: cropland, rainfed

Fraction of dominant landcover type [%]:

59.0


Radius: 5 km

Number of landcover classes:

11

Dominant landcover type:

10: cropland, rainfed

Fraction of dominant landcover type [%]:

51.0


Radius: 10 km

Number of landcover classes:

8

Dominant landcover type:

10: cropland, rainfed

Fraction of dominant landcover type [%]:

71.0


Radius: 20 km

Number of landcover classes:

9

Dominant landcover type:

10: cropland, rainfed

Fraction of dominant landcover type [%]:

69.0


Disturbances


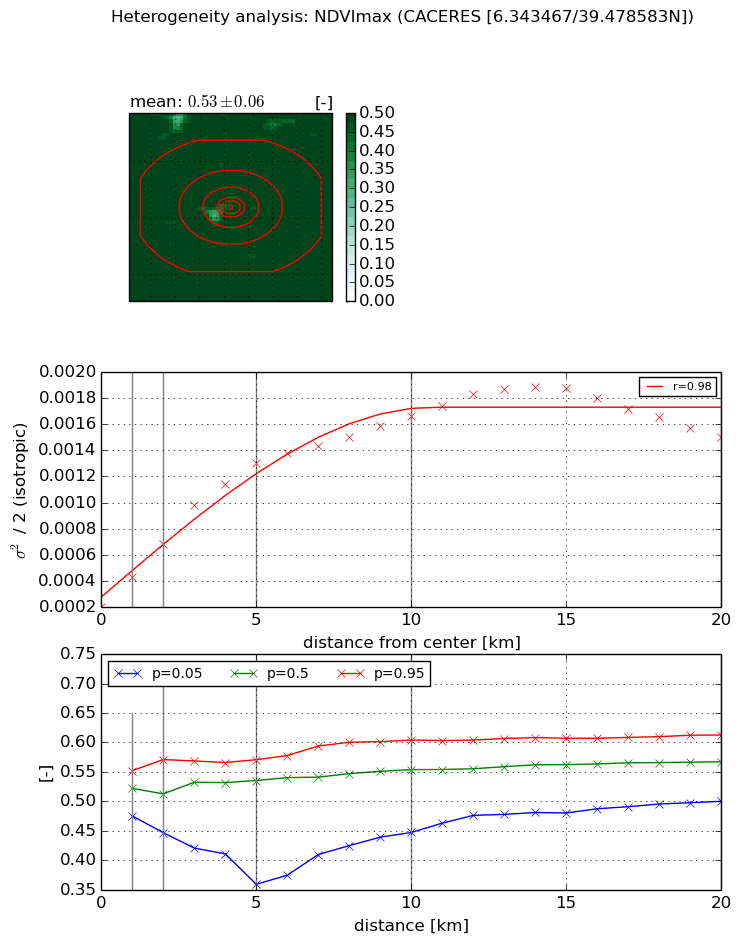
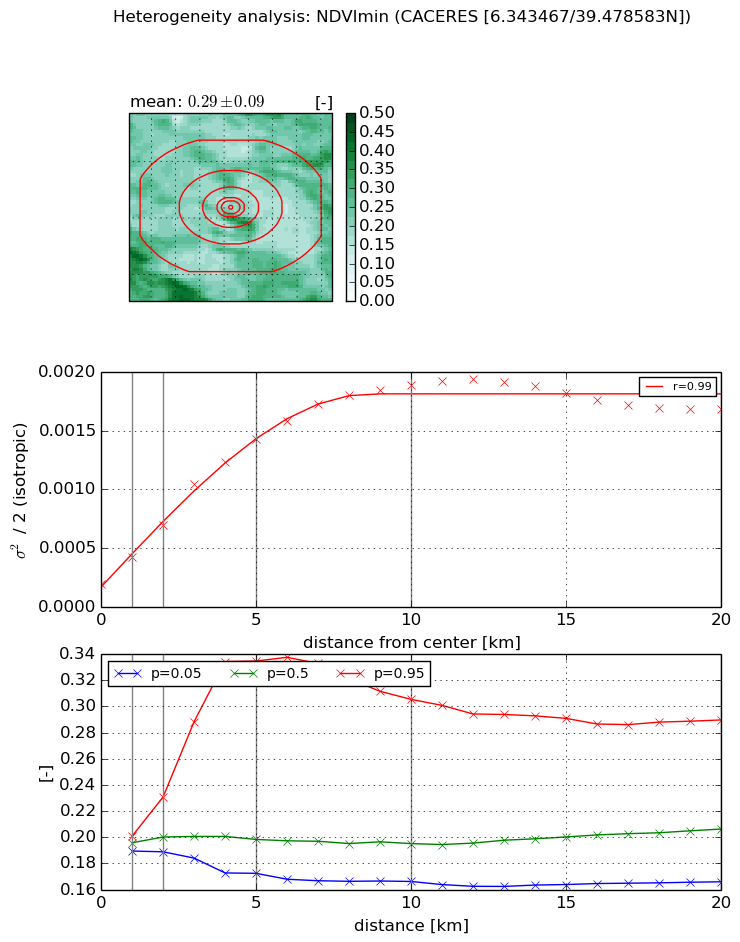
Heterogeneity analysis

The heterogeneity analysis provides information about the spatial and temporal heterogeneity of the site.

Topography


Roman et al. (2009) index


St

3.98314126519

Rcv

0.0141605862682

Rse

0.0

Rst

1.13905942558e-07

Rsv

0.73901369166


Height range @ 1km [m]

59

Height range @ 2km [m]

152

Height range @ 5km [m]

194

Height range @ 10km [m]

-999

Height range @ 20km [m]

-999


Variance slope @ 1 km

644

Variance slope @ 2 km

697

Variance slope @ 5 km

765

Variance slope @ 10 km

-999

Variance slope @ 20 km

-999


NDVI (max. NDVI composite)


Roman et al. (2009) index


St

3.68981816837

Rcv

0.347478684015

Rse

0.0

Rst

-0.26300790219

Rsv

0.202561608342


NDVI range @ 1km [-]

0.08

NDVI range @ 2km [-]

0.12

NDVI range @ 5km [-]

0.21

NDVI range @ 10km [-]

0.16

NDVI range @ 20km [-]

0.11


Variance slope @ 1 km

0.000227672001058

Variance slope @ 2 km

0.000241009317481

Variance slope @ 5 km

0.000227088313799

Variance slope @ 10 km

0.000140889619113

Variance slope @ 20 km

6.119555624e-05


NDVI (min. NDVI composite)I


Roman et al. (2009) index


St

1.46242821574e-07

Rcv

0.545552754635

Rse

0.0

Rst

0.0808529881183

Rsv

20513826.7719


NDVI range @ 1km [-]

0.01

NDVI range @ 2km [-]

0.04

NDVI range @ 5km [-]

0.16

NDVI range @ 10km [-]

0.14

NDVI range @ 20km [-]

0.12


NDVI slope @ 1 km

0.000229102466279

NDVI slope @ 2 km

0.000251736134728

NDVI slope @ 5 km

0.000255569658441

NDVI slope @ 10 km

0.000174699872233

NDVI slope @ 20 km

6.00709627632e-05


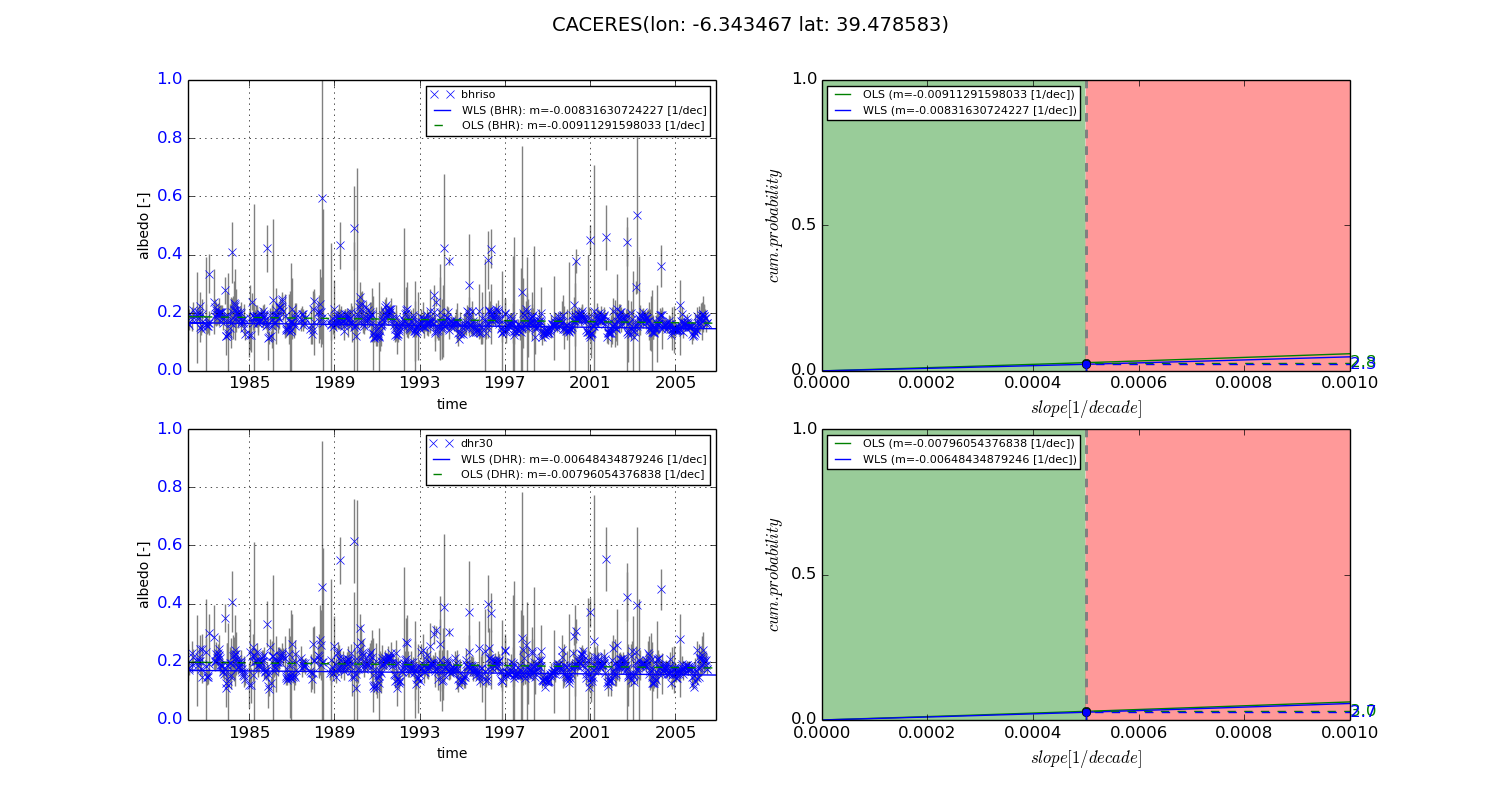
Temporal stability analysis

+000 deg (BHR)


BHR statistics

Temporal stability [1/decade]:


abs

rel


Weighted least square:

-0.00831630724227


Ordinary least square:

-0.00911291598033


Probabilities that GCOS criteria is met:

Weighted least square:

2.3 %

Ordinary least square:

2.8 %


DHR statistics

Temporal stability [1/decade]:


abs

rel


Weighted least square:

-0.00648434879246


Ordinary least square:

-0.00796054376838


Probabilities that GCOS criteria is met:

Weighted least square:

2.7 %

Ordinary least square:

3.0 %


+057/+063 deg (BHR)


BHR statistics

Temporal stability [1/decade]:


abs

rel


Weighted least square:

-99999.0


Ordinary least square:

-99999.0


Probabilities that GCOS criteria is met:

Weighted least square:

-99999.0 %

Ordinary least square:

-99999.0 %


DHR statistics

Temporal stability [1/decade]:


abs

rel


Weighted least square:

-99999.0


Ordinary least square:

-99999.0


Probabilities that GCOS criteria is met:

Weighted least square:

-99999.0 %

Ordinary least square:

-99999.0 %


Temporal anomaly analyis

The variance of the temporal anomalies provides an additional measure about the stability of the signal AFTER removal of the mean seasonal cylce.
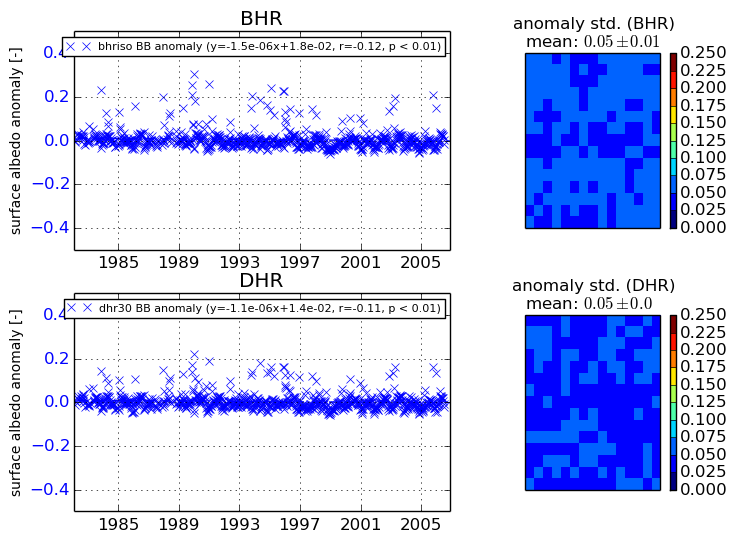
+000 deg


+057/+063 deg