CALDWELL_PARISH_HS


Location

lon / lat [deg]: -92.0963 / 32.0603

Source network: AERONET


Geostationary surface albedo (GSA) data


“+000”


“+057/+063”


Landcover information (based on ESA CCI landcover data)


Landcover fractions @ 2km distance


Landcover fractions @ 20 km distance


Legend


Distance to open water bodies [km]:

1.14

Distance to urban areas [km]:

0.08


Radius: 1 km

Number of landcover classes:

4

Dominant landcover type:

70: Tree cover, needleleaved, evergreen, closed to open (>15%)

Fraction of dominant landcover type [%]:

66.0


Radius: 2 km

Number of landcover classes:

7

Dominant landcover type:

70: Tree cover, needleleaved, evergreen, closed to open (>15%)

Fraction of dominant landcover type [%]:

57.0


Radius: 5 km

Number of landcover classes:

7

Dominant landcover type:

70: Tree cover, needleleaved, evergreen, closed to open (>15%)

Fraction of dominant landcover type [%]:

52.0


Radius: 10 km

Number of landcover classes:

7

Dominant landcover type:

70: Tree cover, needleleaved, evergreen, closed to open (>15%)

Fraction of dominant landcover type [%]:

47.0


Radius: 20 km

Number of landcover classes:

7

Dominant landcover type:

70: Tree cover, needleleaved, evergreen, closed to open (>15%)

Fraction of dominant landcover type [%]:

46.0


Disturbances


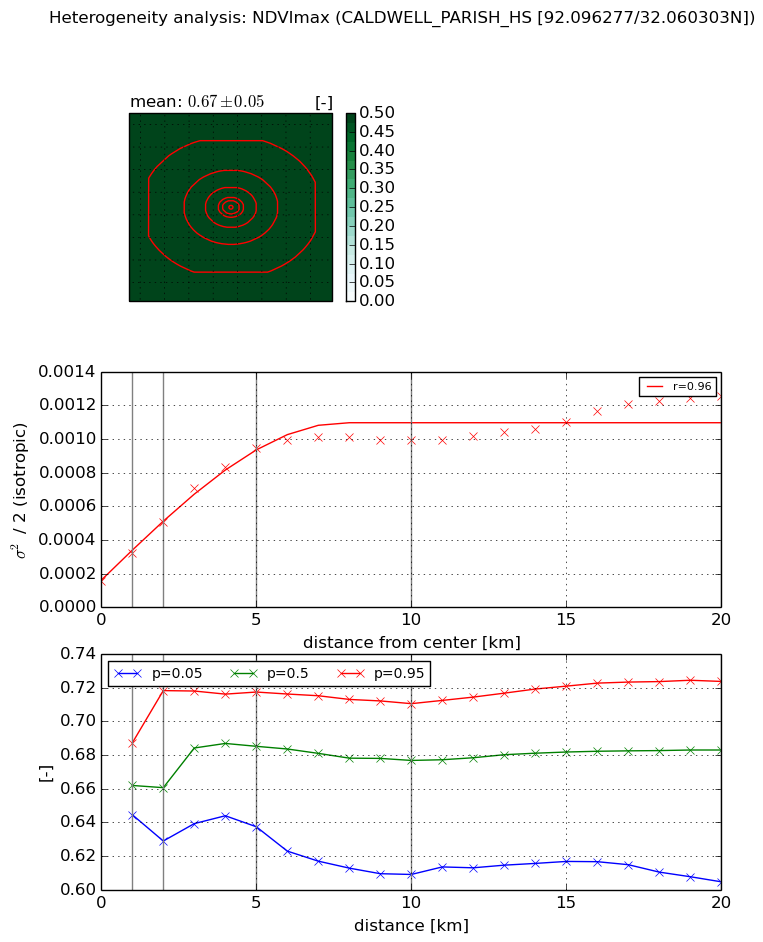
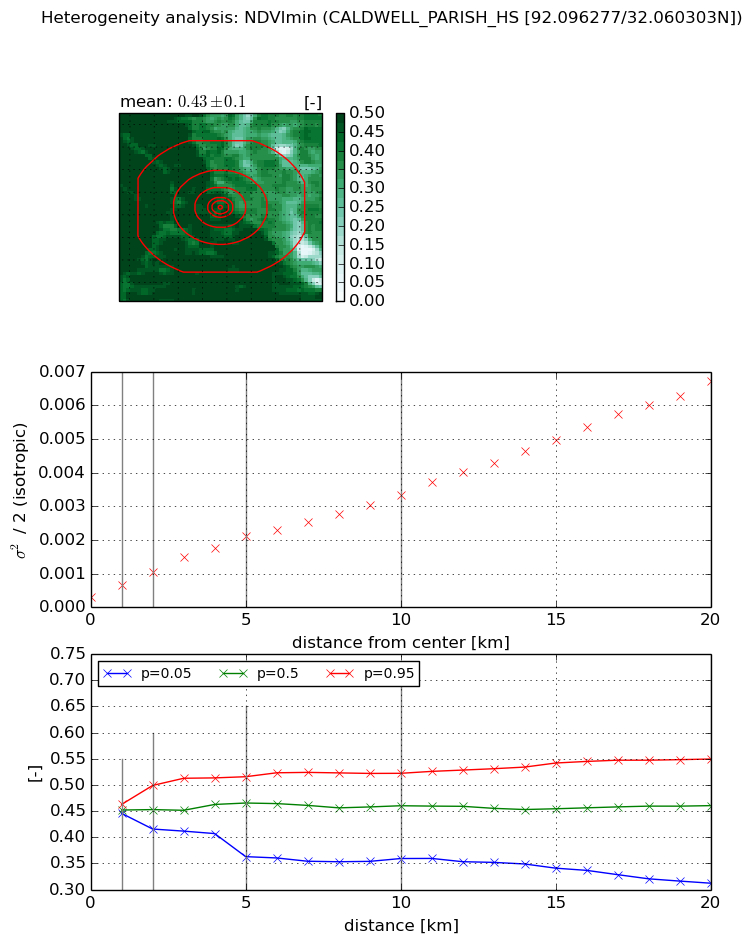
Heterogeneity analysis

The heterogeneity analysis provides information about the spatial and temporal heterogeneity of the site.

Topography


Roman et al. (2009) index


St

2.089975817

Rcv

0.692906664269

Rse

0.0

Rst

0.0447650835781

Rsv

0.697751559732


Height range @ 1km [m]

21

Height range @ 2km [m]

23

Height range @ 5km [m]

49

Height range @ 10km [m]

-999

Height range @ 20km [m]

-999


Variance slope @ 1 km

60

Variance slope @ 2 km

56

Variance slope @ 5 km

47

Variance slope @ 10 km

-999

Variance slope @ 20 km

-999


NDVI (max. NDVI composite)


Roman et al. (2009) index


St

8.67519672786

Rcv

-0.107871601887

Rse

0.0

Rst

-0.155809962346

Rsv

-0.082131919208


NDVI range @ 1km [-]

0.04

NDVI range @ 2km [-]

0.09

NDVI range @ 5km [-]

0.08

NDVI range @ 10km [-]

0.1

NDVI range @ 20km [-]

0.12


Variance slope @ 1 km

0.000169000680595

Variance slope @ 2 km

0.000174880839035

Variance slope @ 5 km

0.000163393855947

Variance slope @ 10 km

8.32203646809e-05

Variance slope @ 20 km

4.1135842057e-05


NDVI (min. NDVI composite)I


Roman et al. (2009) index


St

1.03263622123

Rcv

0.393568554409

Rse

0.0

Rst

-0.32227527604

Rsv

2.1893418858


NDVI range @ 1km [-]

0.02

NDVI range @ 2km [-]

0.08

NDVI range @ 5km [-]

0.15

NDVI range @ 10km [-]

0.16

NDVI range @ 20km [-]

0.24


NDVI slope @ 1 km

0.00037617957023

NDVI slope @ 2 km

0.000378747457131

NDVI slope @ 5 km

0.000362699569541

NDVI slope @ 10 km

0.000295064808725

NDVI slope @ 20 km

0.000308873042516


Temporal stability analysis

+000 deg (BHR)


BHR statistics

Temporal stability [1/decade]:


abs

rel


Weighted least square:

None


Ordinary least square:

None


Probabilities that GCOS criteria is met:

Weighted least square:

None %

Ordinary least square:

None %


DHR statistics

Temporal stability [1/decade]:


abs

rel


Weighted least square:

None


Ordinary least square:

None


Probabilities that GCOS criteria is met:

Weighted least square:

None %

Ordinary least square:

None %


+057/+063 deg (BHR)


BHR statistics

Temporal stability [1/decade]:


abs

rel


Weighted least square:

None


Ordinary least square:

None


Probabilities that GCOS criteria is met:

Weighted least square:

None %

Ordinary least square:

None %


DHR statistics

Temporal stability [1/decade]:


abs

rel


Weighted least square:

None


Ordinary least square:

None


Probabilities that GCOS criteria is met:

Weighted least square:

None %

Ordinary least square:

None %


Temporal anomaly analyis

The variance of the temporal anomalies provides an additional measure about the stability of the signal AFTER removal of the mean seasonal cylce.

+000 deg


+057/+063 deg