CALIPSO_BELMONT_SCL


Location

lon / lat [deg]: -77.4898 / 39.0893

Source network: AERONET


Geostationary surface albedo (GSA) data


“+000”


“+057/+063”


Landcover information (based on ESA CCI landcover data)


Landcover fractions @ 2km distance


Landcover fractions @ 20 km distance


Legend


Distance to open water bodies [km]:

1.39

Distance to urban areas [km]:

0.28


Radius: 1 km

Number of landcover classes:

4

Dominant landcover type:

190: urban areas

Fraction of dominant landcover type [%]:

68.0


Radius: 2 km

Number of landcover classes:

6

Dominant landcover type:

190: urban areas

Fraction of dominant landcover type [%]:

54.0


Radius: 5 km

Number of landcover classes:

6

Dominant landcover type:

190: urban areas

Fraction of dominant landcover type [%]:

41.0


Radius: 10 km

Number of landcover classes:

8

Dominant landcover type:

130: grassland

Fraction of dominant landcover type [%]:

50.0


Radius: 20 km

Number of landcover classes:

7

Dominant landcover type:

130: grassland

Fraction of dominant landcover type [%]:

60.0


Disturbances


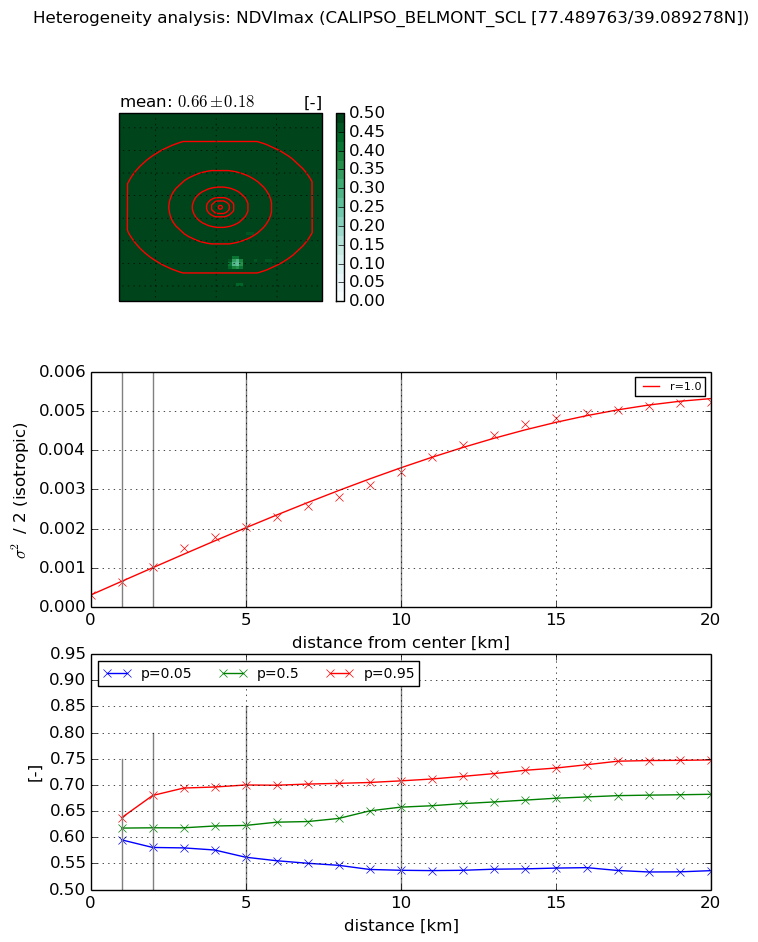
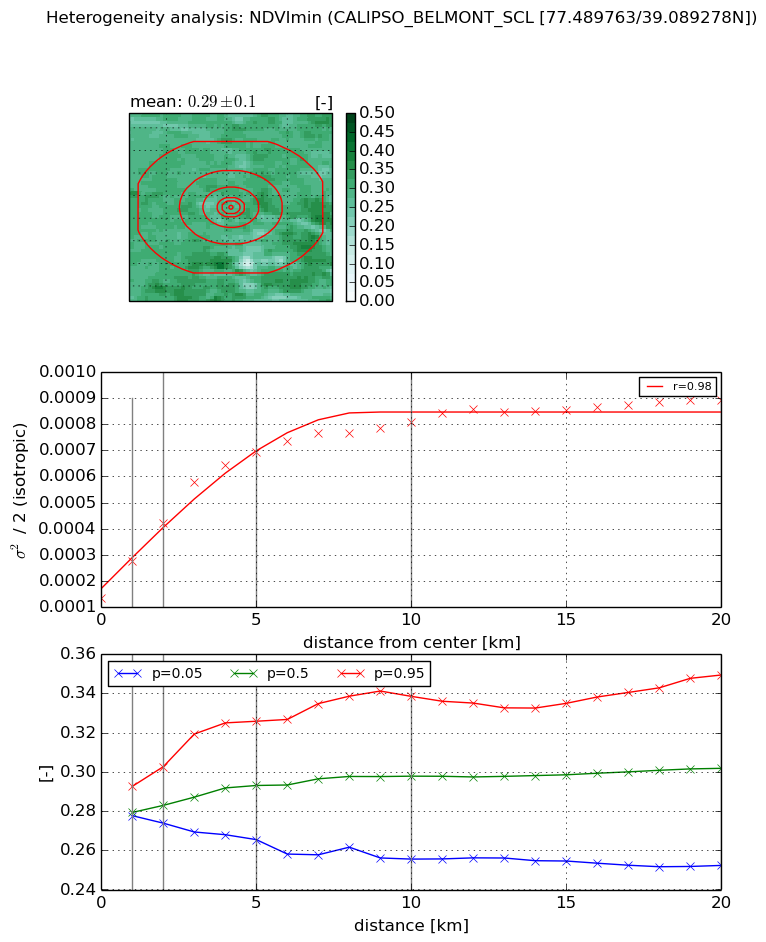
Heterogeneity analysis

The heterogeneity analysis provides information about the spatial and temporal heterogeneity of the site.

Topography


Roman et al. (2009) index


St

31.8287387603

Rcv

-0.0440310257242

Rse

0.0

Rst

-0.0341650853604

Rsv

-0.0160583305568


Height range @ 1km [m]

33

Height range @ 2km [m]

49

Height range @ 5km [m]

50

Height range @ 10km [m]

-999

Height range @ 20km [m]

-999


Variance slope @ 1 km

126

Variance slope @ 2 km

107

Variance slope @ 5 km

46

Variance slope @ 10 km

-999

Variance slope @ 20 km

-999


NDVI (max. NDVI composite)


Roman et al. (2009) index


St

2.27334330572

Rcv

0.160729786204

Rse

0.0

Rst

-0.159692947537

Rsv

-0.999219571254


NDVI range @ 1km [-]

0.04

NDVI range @ 2km [-]

0.1

NDVI range @ 5km [-]

0.14

NDVI range @ 10km [-]

0.17

NDVI range @ 20km [-]

0.21


Variance slope @ 1 km

0.000345527580673

Variance slope @ 2 km

0.000361728512603

Variance slope @ 5 km

0.000359615841745

Variance slope @ 10 km

0.000304769160873

Variance slope @ 20 km

0.000258830190508


NDVI (min. NDVI composite)I


Roman et al. (2009) index


St

3.89731104114

Rcv

0.184585106565

Rse

0.0

Rst

-3.07705341913e-08

Rsv

-0.585176364462


NDVI range @ 1km [-]

0.01

NDVI range @ 2km [-]

0.03

NDVI range @ 5km [-]

0.06

NDVI range @ 10km [-]

0.08

NDVI range @ 20km [-]

0.1


NDVI slope @ 1 km

0.000140814684231

NDVI slope @ 2 km

0.000144392256095

NDVI slope @ 5 km

0.000115922873683

NDVI slope @ 10 km

6.28697127423e-05

NDVI slope @ 20 km

2.84666091312e-05


Temporal stability analysis

+000 deg (BHR)


BHR statistics

Temporal stability [1/decade]:


abs

rel


Weighted least square:

-99999.0


Ordinary least square:

-99999.0


Probabilities that GCOS criteria is met:

Weighted least square:

-99999.0 %

Ordinary least square:

-99999.0 %


DHR statistics

Temporal stability [1/decade]:


abs

rel


Weighted least square:

-99999.0


Ordinary least square:

-99999.0


Probabilities that GCOS criteria is met:

Weighted least square:

-99999.0 %

Ordinary least square:

-99999.0 %


+057/+063 deg (BHR)


BHR statistics

Temporal stability [1/decade]:


abs

rel


Weighted least square:

None


Ordinary least square:

None


Probabilities that GCOS criteria is met:

Weighted least square:

None %

Ordinary least square:

None %


DHR statistics

Temporal stability [1/decade]:


abs

rel


Weighted least square:

None


Ordinary least square:

None


Probabilities that GCOS criteria is met:

Weighted least square:

None %

Ordinary least square:

None %


Temporal anomaly analyis

The variance of the temporal anomalies provides an additional measure about the stability of the signal AFTER removal of the mean seasonal cylce.

+000 deg


+057/+063 deg