CALIPSO_CARTHAGE


Location

lon / lat [deg]: -94.0663 / 32.0643

Source network: AERONET


Geostationary surface albedo (GSA) data


“+000”


“+057/+063”


Landcover information (based on ESA CCI landcover data)


Landcover fractions @ 2km distance


Landcover fractions @ 20 km distance


Legend


Distance to open water bodies [km]:

3.92

Distance to urban areas [km]:

1.93


Radius: 1 km

Number of landcover classes:

2

Dominant landcover type:

70: Tree cover, needleleaved, evergreen, closed to open (>15%)

Fraction of dominant landcover type [%]:

68.0


Radius: 2 km

Number of landcover classes:

3

Dominant landcover type:

70: Tree cover, needleleaved, evergreen, closed to open (>15%)

Fraction of dominant landcover type [%]:

72.0


Radius: 5 km

Number of landcover classes:

4

Dominant landcover type:

70: Tree cover, needleleaved, evergreen, closed to open (>15%)

Fraction of dominant landcover type [%]:

69.0


Radius: 10 km

Number of landcover classes:

4

Dominant landcover type:

70: Tree cover, needleleaved, evergreen, closed to open (>15%)

Fraction of dominant landcover type [%]:

52.0


Radius: 20 km

Number of landcover classes:

5

Dominant landcover type:

70: Tree cover, needleleaved, evergreen, closed to open (>15%)

Fraction of dominant landcover type [%]:

54.0


Disturbances


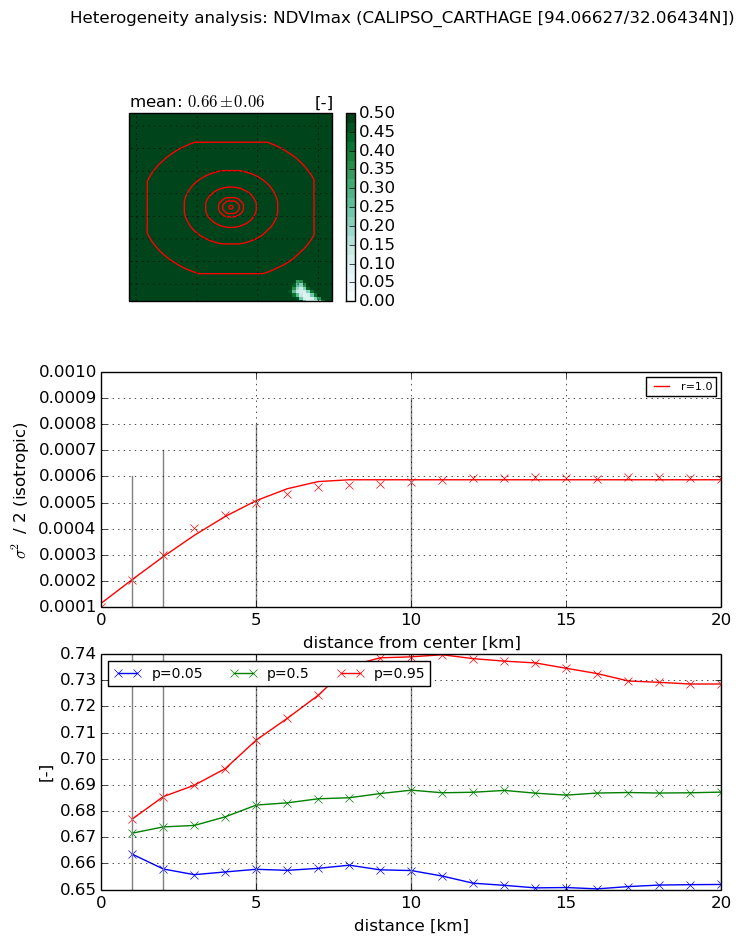
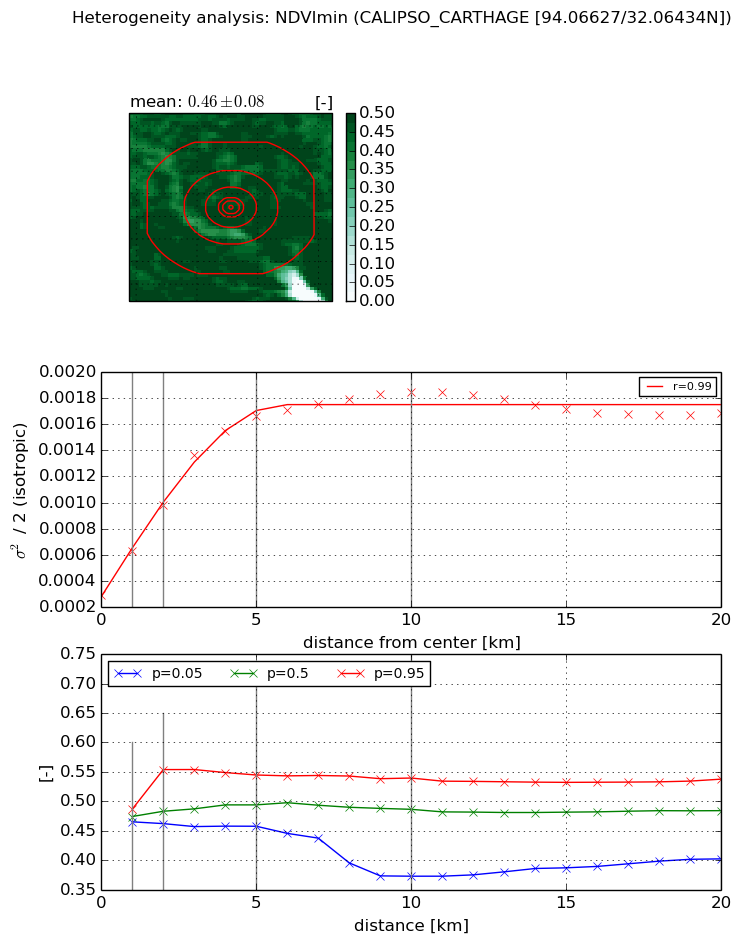
Heterogeneity analysis

The heterogeneity analysis provides information about the spatial and temporal heterogeneity of the site.

Topography


Roman et al. (2009) index


St

2.19058076056

Rcv

0.317313720416

Rse

0.0

Rst

-0.0521861198263

Rsv

-0.99999999926


Height range @ 1km [m]

23

Height range @ 2km [m]

27

Height range @ 5km [m]

33

Height range @ 10km [m]

-999

Height range @ 20km [m]

-999


Variance slope @ 1 km

38

Variance slope @ 2 km

28

Variance slope @ 5 km

22

Variance slope @ 10 km

-999

Variance slope @ 20 km

-999


NDVI (max. NDVI composite)


Roman et al. (2009) index


St

7.89897694827

Rcv

0.266440643383

Rse

0.0

Rst

-0.103148257331

Rsv

-0.0102071183963


NDVI range @ 1km [-]

0.01

NDVI range @ 2km [-]

0.03

NDVI range @ 5km [-]

0.05

NDVI range @ 10km [-]

0.08

NDVI range @ 20km [-]

0.08


Variance slope @ 1 km

0.000100702673838

Variance slope @ 2 km

9.98199480906e-05

Variance slope @ 5 km

8.13251367935e-05

Variance slope @ 10 km

4.58739654471e-05

Variance slope @ 20 km

1.80686061483e-05


NDVI (min. NDVI composite)I


Roman et al. (2009) index


St

3.77190693827

Rcv

-0.182532154462

Rse

0.0

Rst

0.247920315269

Rsv

-0.36490119331


NDVI range @ 1km [-]

0.02

NDVI range @ 2km [-]

0.09

NDVI range @ 5km [-]

0.09

NDVI range @ 10km [-]

0.17

NDVI range @ 20km [-]

0.14


NDVI slope @ 1 km

0.000331594382001

NDVI slope @ 2 km

0.000344716614896

NDVI slope @ 5 km

0.00028506406966

NDVI slope @ 10 km

0.000145025517761

NDVI slope @ 20 km

4.21338511845e-05


Temporal stability analysis

+000 deg (BHR)


BHR statistics

Temporal stability [1/decade]:


abs

rel


Weighted least square:

None


Ordinary least square:

None


Probabilities that GCOS criteria is met:

Weighted least square:

None %

Ordinary least square:

None %


DHR statistics

Temporal stability [1/decade]:


abs

rel


Weighted least square:

None


Ordinary least square:

None


Probabilities that GCOS criteria is met:

Weighted least square:

None %

Ordinary least square:

None %


+057/+063 deg (BHR)


BHR statistics

Temporal stability [1/decade]:


abs

rel


Weighted least square:

None


Ordinary least square:

None


Probabilities that GCOS criteria is met:

Weighted least square:

None %

Ordinary least square:

None %


DHR statistics

Temporal stability [1/decade]:


abs

rel


Weighted least square:

None


Ordinary least square:

None


Probabilities that GCOS criteria is met:

Weighted least square:

None %

Ordinary least square:

None %


Temporal anomaly analyis

The variance of the temporal anomalies provides an additional measure about the stability of the signal AFTER removal of the mean seasonal cylce.

+000 deg


+057/+063 deg