CALIPSO_LOUDON_RD


Location

lon / lat [deg]: -77.7885 / 39.9389

Source network: AERONET


Geostationary surface albedo (GSA) data


“+000”


“+057/+063”


Landcover information (based on ESA CCI landcover data)


Landcover fractions @ 2km distance


Landcover fractions @ 20 km distance


Legend


Distance to open water bodies [km]:

9.78

Distance to urban areas [km]:

3.04


Radius: 1 km

Number of landcover classes:

2

Dominant landcover type:

130: grassland

Fraction of dominant landcover type [%]:

73.0


Radius: 2 km

Number of landcover classes:

3

Dominant landcover type:

130: grassland

Fraction of dominant landcover type [%]:

79.0


Radius: 5 km

Number of landcover classes:

5

Dominant landcover type:

130: grassland

Fraction of dominant landcover type [%]:

73.0


Radius: 10 km

Number of landcover classes:

5

Dominant landcover type:

130: grassland

Fraction of dominant landcover type [%]:

60.0


Radius: 20 km

Number of landcover classes:

6

Dominant landcover type:

130: grassland

Fraction of dominant landcover type [%]:

54.0


Disturbances


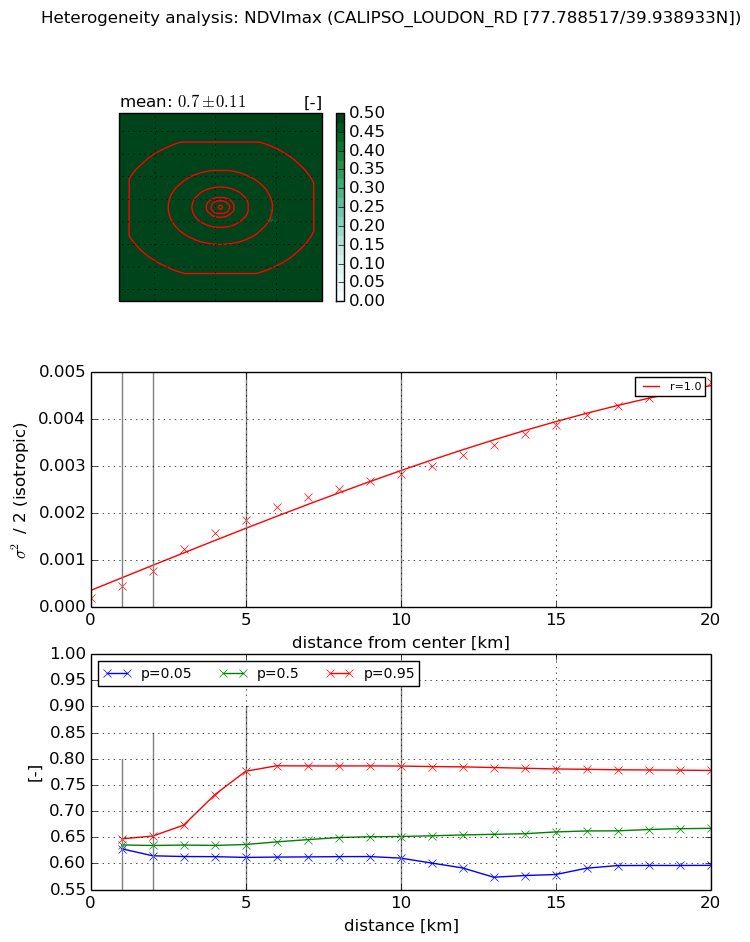
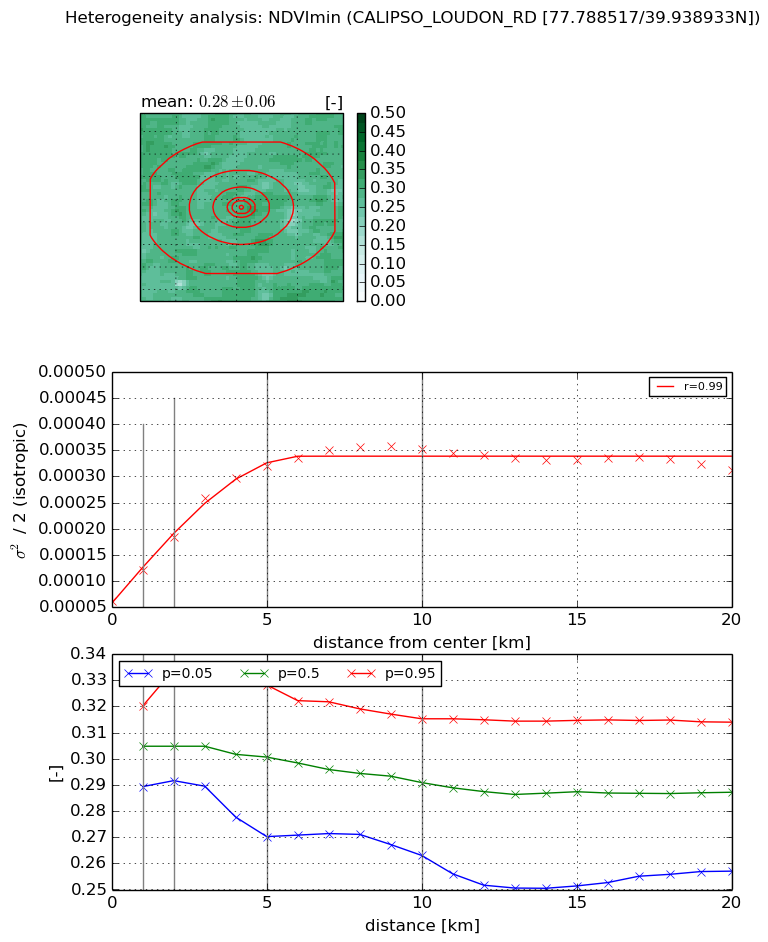
Heterogeneity analysis

The heterogeneity analysis provides information about the spatial and temporal heterogeneity of the site.

Topography


Roman et al. (2009) index


St

0.0729065132739

Rcv

2.62377184631

Rse

0.0

Rst

6.22476145954e-07

Rsv

38.524814472


Height range @ 1km [m]

23

Height range @ 2km [m]

49

Height range @ 5km [m]

250

Height range @ 10km [m]

-999

Height range @ 20km [m]

-999


Variance slope @ 1 km

1334

Variance slope @ 2 km

1602

Variance slope @ 5 km

1707

Variance slope @ 10 km

-999

Variance slope @ 20 km

-999


NDVI (max. NDVI composite)


Roman et al. (2009) index


St

1.34940931701

Rcv

1.31083637526

Rse

0.0

Rst

-3.2609350309e-09

Rsv

0.912358586995


NDVI range @ 1km [-]

0.02

NDVI range @ 2km [-]

0.04

NDVI range @ 5km [-]

0.16

NDVI range @ 10km [-]

0.18

NDVI range @ 20km [-]

0.18


Variance slope @ 1 km

0.000255128797105

Variance slope @ 2 km

0.000278477562445

Variance slope @ 5 km

0.000344888409228

Variance slope @ 10 km

0.000274171514129

Variance slope @ 20 km

0.00022175652008


NDVI (min. NDVI composite)I


Roman et al. (2009) index


St

10.9086937482

Rcv

0.0813871501337

Rse

0.0

Rst

0.0116731512349

Rsv

-0.181949710759


NDVI range @ 1km [-]

0.03

NDVI range @ 2km [-]

0.04

NDVI range @ 5km [-]

0.06

NDVI range @ 10km [-]

0.05

NDVI range @ 20km [-]

0.06


NDVI slope @ 1 km

6.03597415463e-05

NDVI slope @ 2 km

6.17115016105e-05

NDVI slope @ 5 km

5.41290782237e-05

NDVI slope @ 10 km

2.86060065708e-05

NDVI slope @ 20 km

8.14401562284e-06


Temporal stability analysis

+000 deg (BHR)


BHR statistics

Temporal stability [1/decade]:


abs

rel


Weighted least square:

-99999.0


Ordinary least square:

-99999.0


Probabilities that GCOS criteria is met:

Weighted least square:

-99999.0 %

Ordinary least square:

-99999.0 %


DHR statistics

Temporal stability [1/decade]:


abs

rel


Weighted least square:

-99999.0


Ordinary least square:

-99999.0


Probabilities that GCOS criteria is met:

Weighted least square:

-99999.0 %

Ordinary least square:

-99999.0 %


+057/+063 deg (BHR)


BHR statistics

Temporal stability [1/decade]:


abs

rel


Weighted least square:

None


Ordinary least square:

None


Probabilities that GCOS criteria is met:

Weighted least square:

None %

Ordinary least square:

None %


DHR statistics

Temporal stability [1/decade]:


abs

rel


Weighted least square:

None


Ordinary least square:

None


Probabilities that GCOS criteria is met:

Weighted least square:

None %

Ordinary least square:

None %


Temporal anomaly analyis

The variance of the temporal anomalies provides an additional measure about the stability of the signal AFTER removal of the mean seasonal cylce.

+000 deg


+057/+063 deg