CALIPSO_SABINE_FRST


Location

lon / lat [deg]: -93.8674 / 31.6073

Source network: AERONET


Geostationary surface albedo (GSA) data


“+000”


“+057/+063”


Landcover information (based on ESA CCI landcover data)


Landcover fractions @ 2km distance


Landcover fractions @ 20 km distance


Legend


Distance to open water bodies [km]:

0.73

Distance to urban areas [km]:

3.13


Radius: 1 km

Number of landcover classes:

3

Dominant landcover type:

70: Tree cover, needleleaved, evergreen, closed to open (>15%)

Fraction of dominant landcover type [%]:

82.0


Radius: 2 km

Number of landcover classes:

4

Dominant landcover type:

70: Tree cover, needleleaved, evergreen, closed to open (>15%)

Fraction of dominant landcover type [%]:

63.0


Radius: 5 km

Number of landcover classes:

5

Dominant landcover type:

70: Tree cover, needleleaved, evergreen, closed to open (>15%)

Fraction of dominant landcover type [%]:

48.0


Radius: 10 km

Number of landcover classes:

5

Dominant landcover type:

70: Tree cover, needleleaved, evergreen, closed to open (>15%)

Fraction of dominant landcover type [%]:

38.0


Radius: 20 km

Number of landcover classes:

5

Dominant landcover type:

70: Tree cover, needleleaved, evergreen, closed to open (>15%)

Fraction of dominant landcover type [%]:

49.0


Disturbances


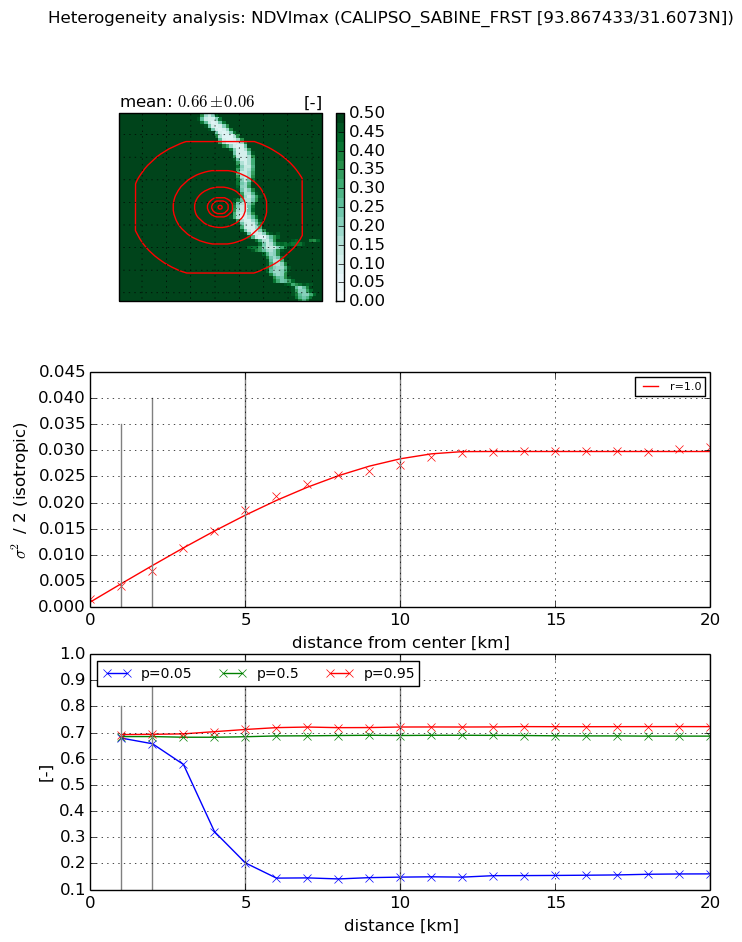
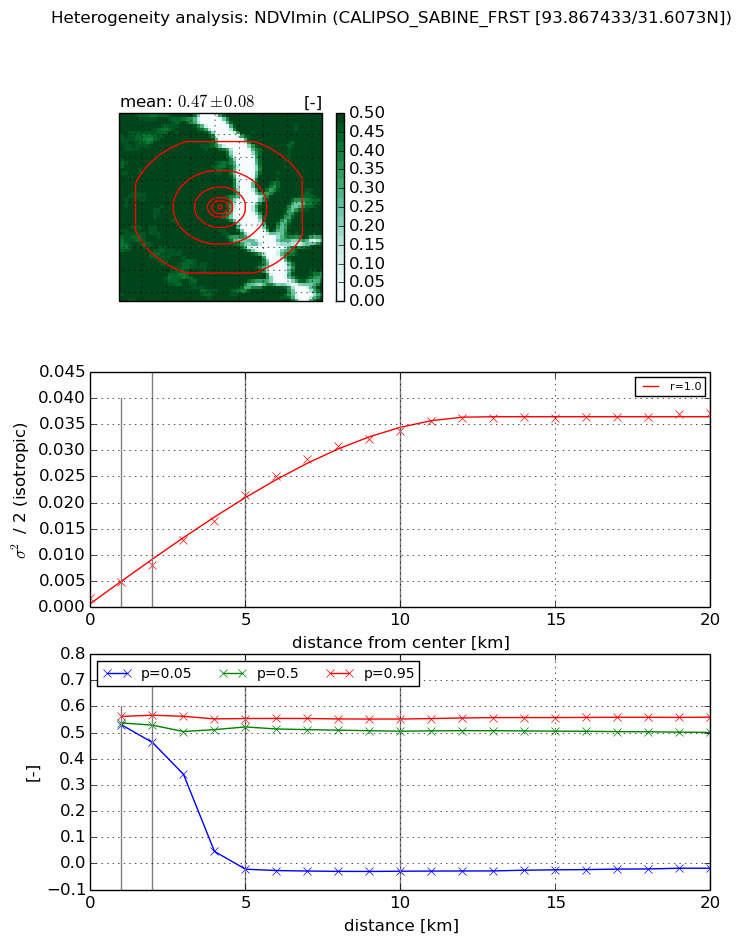
Heterogeneity analysis

The heterogeneity analysis provides information about the spatial and temporal heterogeneity of the site.

Topography


Roman et al. (2009) index


St

1.55696257997e-05

Rcv

0.206397362303

Rse

0.0

Rst

-0.142069997518

Rsv

192682.50972


Height range @ 1km [m]

29

Height range @ 2km [m]

36

Height range @ 5km [m]

42

Height range @ 10km [m]

-999

Height range @ 20km [m]

-999


Variance slope @ 1 km

80

Variance slope @ 2 km

60

Variance slope @ 5 km

35

Variance slope @ 10 km

-999

Variance slope @ 20 km

-999


NDVI (max. NDVI composite)


Roman et al. (2009) index


St

2.54332125689e-07

Rcv

2.63384221775

Rse

0.0

Rst

0.349167743946

Rsv

11795596.9314


NDVI range @ 1km [-]

0.01

NDVI range @ 2km [-]

0.04

NDVI range @ 5km [-]

0.51

NDVI range @ 10km [-]

0.57

NDVI range @ 20km [-]

0.56


Variance slope @ 1 km

0.00257421555598

Variance slope @ 2 km

0.00275715728789

Variance slope @ 5 km

0.00346576322603

Variance slope @ 10 km

0.00275507198915

Variance slope @ 20 km

0.00136284282103


NDVI (min. NDVI composite)I


Roman et al. (2009) index


St

9.92109058523e-08

Rcv

1.67733296222

Rse

0.0

Rst

0.241284948196

Rsv

30238609.192


NDVI range @ 1km [-]

0.03

NDVI range @ 2km [-]

0.1

NDVI range @ 5km [-]

0.58

NDVI range @ 10km [-]

0.58

NDVI range @ 20km [-]

0.58


NDVI slope @ 1 km

0.00288931448944

NDVI slope @ 2 km

0.00306753256355

NDVI slope @ 5 km

0.00396919076489

NDVI slope @ 10 km

0.00342037211738

NDVI slope @ 20 km

0.00170023318981


Temporal stability analysis

+000 deg (BHR)


BHR statistics

Temporal stability [1/decade]:


abs

rel


Weighted least square:

None


Ordinary least square:

None


Probabilities that GCOS criteria is met:

Weighted least square:

None %

Ordinary least square:

None %


DHR statistics

Temporal stability [1/decade]:


abs

rel


Weighted least square:

None


Ordinary least square:

None


Probabilities that GCOS criteria is met:

Weighted least square:

None %

Ordinary least square:

None %


+057/+063 deg (BHR)


BHR statistics

Temporal stability [1/decade]:


abs

rel


Weighted least square:

None


Ordinary least square:

None


Probabilities that GCOS criteria is met:

Weighted least square:

None %

Ordinary least square:

None %


DHR statistics

Temporal stability [1/decade]:


abs

rel


Weighted least square:

None


Ordinary least square:

None


Probabilities that GCOS criteria is met:

Weighted least square:

None %

Ordinary least square:

None %


Temporal anomaly analyis

The variance of the temporal anomalies provides an additional measure about the stability of the signal AFTER removal of the mean seasonal cylce.

+000 deg


+057/+063 deg