CALIPSO_STRASBURG


Location

lon / lat [deg]: -76.2193 / 39.9345

Source network: AERONET


Geostationary surface albedo (GSA) data


“+000”


“+057/+063”


Landcover information (based on ESA CCI landcover data)


Landcover fractions @ 2km distance


Landcover fractions @ 20 km distance


Legend


Distance to open water bodies [km]:

10.92

Distance to urban areas [km]:

2.92


Radius: 1 km

Number of landcover classes:

5

Dominant landcover type:

130: grassland

Fraction of dominant landcover type [%]:

62.0


Radius: 2 km

Number of landcover classes:

5

Dominant landcover type:

130: grassland

Fraction of dominant landcover type [%]:

64.0


Radius: 5 km

Number of landcover classes:

5

Dominant landcover type:

130: grassland

Fraction of dominant landcover type [%]:

66.0


Radius: 10 km

Number of landcover classes:

7

Dominant landcover type:

130: grassland

Fraction of dominant landcover type [%]:

58.0


Radius: 20 km

Number of landcover classes:

8

Dominant landcover type:

130: grassland

Fraction of dominant landcover type [%]:

48.0


Disturbances


Heterogeneity analysis

The heterogeneity analysis provides information about the spatial and temporal heterogeneity of the site.

Topography


Roman et al. (2009) index


St

2.03889615928e-07

Rcv

0.591817278207

Rse

0.0

Rst

-0.00334598405371

Rsv

14713843.3951


Height range @ 1km [m]

47

Height range @ 2km [m]

54

Height range @ 5km [m]

116

Height range @ 10km [m]

-999

Height range @ 20km [m]

-999


Variance slope @ 1 km

347

Variance slope @ 2 km

317

Variance slope @ 5 km

320

Variance slope @ 10 km

-999

Variance slope @ 20 km

-999


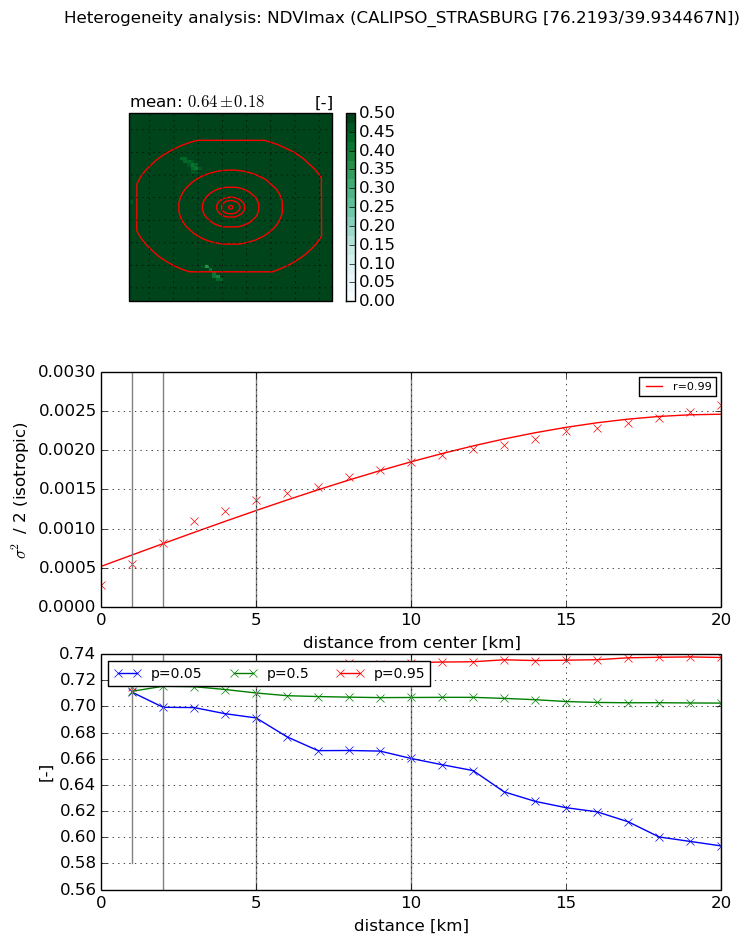
NDVI (max. NDVI composite)


Roman et al. (2009) index


St

1.29117587839e-07

Rcv

0.197239545116

Rse

0.0

Rst

0.203678973947

Rsv

23234634.4014


NDVI range @ 1km [-]

0.0

NDVI range @ 2km [-]

0.03

NDVI range @ 5km [-]

0.03

NDVI range @ 10km [-]

0.07

NDVI range @ 20km [-]

0.14


Variance slope @ 1 km

0.000262762481866

Variance slope @ 2 km

0.000268626049853

Variance slope @ 5 km

0.000221225220436

Variance slope @ 10 km

0.000147633371136

Variance slope @ 20 km

0.000101133899864


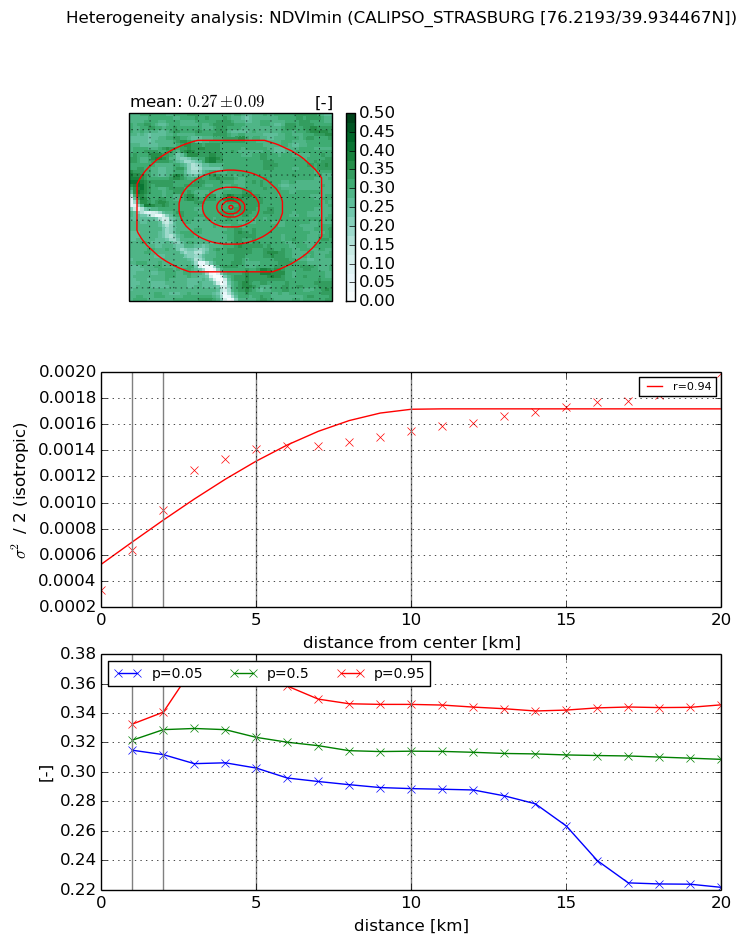
NDVI (min. NDVI composite)I


Roman et al. (2009) index


St

5.25567113659e-05

Rcv

0.0315004049963

Rse

0.0

Rst

-0.0462445968886

Rsv

57081.1193473


NDVI range @ 1km [-]

0.02

NDVI range @ 2km [-]

0.03

NDVI range @ 5km [-]

0.06

NDVI range @ 10km [-]

0.06

NDVI range @ 20km [-]

0.12


NDVI slope @ 1 km

0.000302463994757

NDVI slope @ 2 km

0.000304807528213

NDVI slope @ 5 km

0.000222008761312

NDVI slope @ 10 km

0.000104908014189

NDVI slope @ 20 km

5.83004443534e-05


Temporal stability analysis

+000 deg (BHR)


BHR statistics

Temporal stability [1/decade]:


abs

rel


Weighted least square:

-99999.0


Ordinary least square:

-99999.0


Probabilities that GCOS criteria is met:

Weighted least square:

-99999.0 %

Ordinary least square:

-99999.0 %


DHR statistics

Temporal stability [1/decade]:


abs

rel


Weighted least square:

-99999.0


Ordinary least square:

-99999.0


Probabilities that GCOS criteria is met:

Weighted least square:

-99999.0 %

Ordinary least square:

-99999.0 %


+057/+063 deg (BHR)


BHR statistics

Temporal stability [1/decade]:


abs

rel


Weighted least square:

None


Ordinary least square:

None


Probabilities that GCOS criteria is met:

Weighted least square:

None %

Ordinary least square:

None %


DHR statistics

Temporal stability [1/decade]:


abs

rel


Weighted least square:

None


Ordinary least square:

None


Probabilities that GCOS criteria is met:

Weighted least square:

None %

Ordinary least square:

None %


Temporal anomaly analyis

The variance of the temporal anomalies provides an additional measure about the stability of the signal AFTER removal of the mean seasonal cylce.

+000 deg


+057/+063 deg