CALIPSO_W_STRASBURG


Location

lon / lat [deg]: -76.2311 / 39.9466

Source network: AERONET


Geostationary surface albedo (GSA) data


“+000”


“+057/+063”


Landcover information (based on ESA CCI landcover data)


Landcover fractions @ 2km distance


Landcover fractions @ 20 km distance


Legend


Distance to open water bodies [km]:

11.8

Distance to urban areas [km]:

2.37


Radius: 1 km

Number of landcover classes:

4

Dominant landcover type:

10: cropland, rainfed

Fraction of dominant landcover type [%]:

46.0


Radius: 2 km

Number of landcover classes:

4

Dominant landcover type:

130: grassland

Fraction of dominant landcover type [%]:

66.0


Radius: 5 km

Number of landcover classes:

6

Dominant landcover type:

130: grassland

Fraction of dominant landcover type [%]:

66.0


Radius: 10 km

Number of landcover classes:

7

Dominant landcover type:

130: grassland

Fraction of dominant landcover type [%]:

59.0


Radius: 20 km

Number of landcover classes:

8

Dominant landcover type:

130: grassland

Fraction of dominant landcover type [%]:

47.0


Disturbances


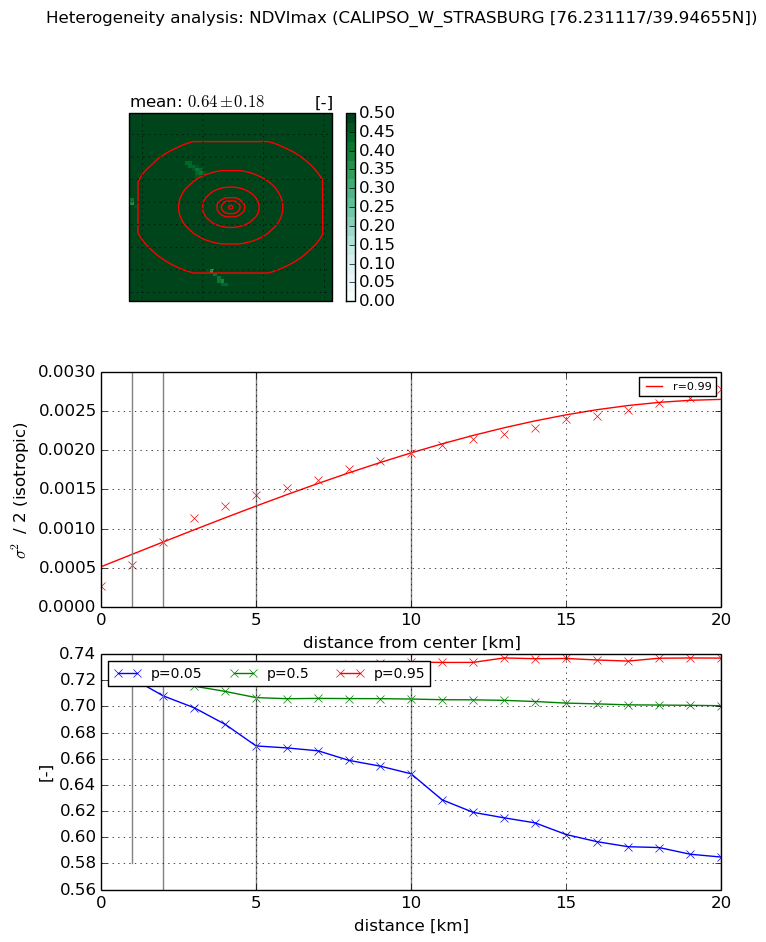
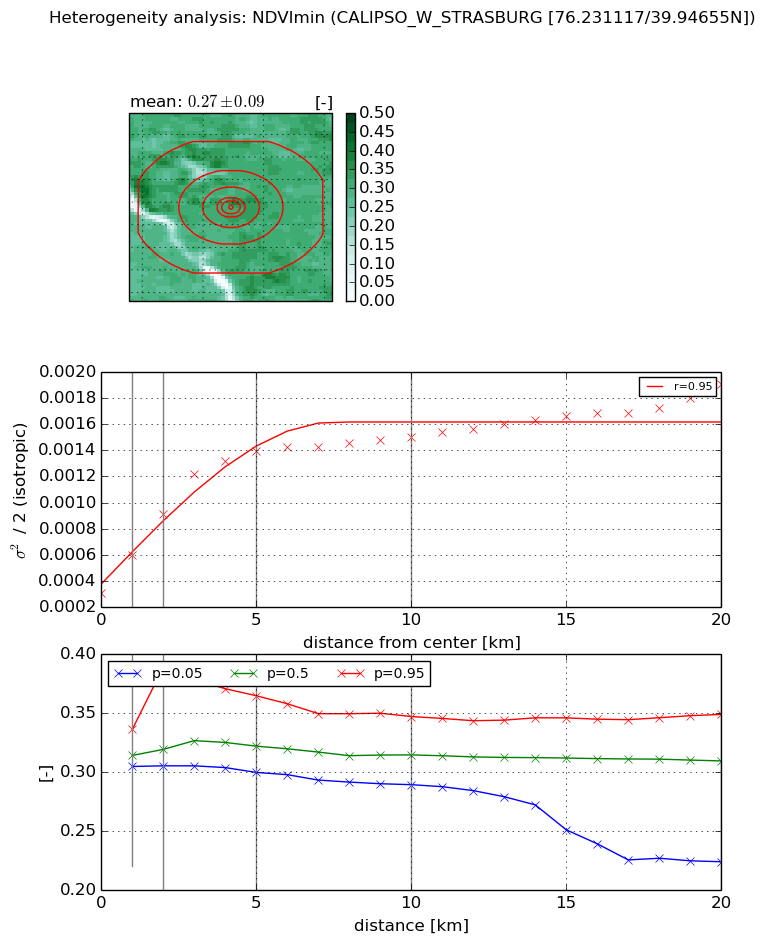
Heterogeneity analysis

The heterogeneity analysis provides information about the spatial and temporal heterogeneity of the site.

Topography


Roman et al. (2009) index


St

6.92653377643

Rcv

0.278166348562

Rse

0.0

Rst

0.0282408066826

Rsv

0.126709912661


Height range @ 1km [m]

31

Height range @ 2km [m]

49

Height range @ 5km [m]

88

Height range @ 10km [m]

-999

Height range @ 20km [m]

-999


Variance slope @ 1 km

301

Variance slope @ 2 km

234

Variance slope @ 5 km

193

Variance slope @ 10 km

-999

Variance slope @ 20 km

-999


NDVI (max. NDVI composite)


Roman et al. (2009) index


St

1.66305105838

Rcv

0.725500702779

Rse

0.0

Rst

-0.0784127808868

Rsv

-0.99999986276


NDVI range @ 1km [-]

0.0

NDVI range @ 2km [-]

0.02

NDVI range @ 5km [-]

0.06

NDVI range @ 10km [-]

0.09

NDVI range @ 20km [-]

0.15


Variance slope @ 1 km

0.000264379750299

Variance slope @ 2 km

0.000280589168045

Variance slope @ 5 km

0.000237548898104

Variance slope @ 10 km

0.000161360205684

Variance slope @ 20 km

0.000111048169664


NDVI (min. NDVI composite)I


Roman et al. (2009) index


St

6.20957600295

Rcv

-0.171324039172

Rse

0.0

Rst

0.0787015514183

Rsv

-0.233099182916


NDVI range @ 1km [-]

0.03

NDVI range @ 2km [-]

0.08

NDVI range @ 5km [-]

0.07

NDVI range @ 10km [-]

0.06

NDVI range @ 20km [-]

0.13


NDVI slope @ 1 km

0.000293737726601

NDVI slope @ 2 km

0.000302803021538

NDVI slope @ 5 km

0.000225475965037

NDVI slope @ 10 km

0.000105714144867

NDVI slope @ 20 km

5.41911329055e-05


Temporal stability analysis

+000 deg (BHR)


BHR statistics

Temporal stability [1/decade]:


abs

rel


Weighted least square:

-99999.0


Ordinary least square:

-99999.0


Probabilities that GCOS criteria is met:

Weighted least square:

-99999.0 %

Ordinary least square:

-99999.0 %


DHR statistics

Temporal stability [1/decade]:


abs

rel


Weighted least square:

-99999.0


Ordinary least square:

-99999.0


Probabilities that GCOS criteria is met:

Weighted least square:

-99999.0 %

Ordinary least square:

-99999.0 %


+057/+063 deg (BHR)


BHR statistics

Temporal stability [1/decade]:


abs

rel


Weighted least square:

None


Ordinary least square:

None


Probabilities that GCOS criteria is met:

Weighted least square:

None %

Ordinary least square:

None %


DHR statistics

Temporal stability [1/decade]:


abs

rel


Weighted least square:

None


Ordinary least square:

None


Probabilities that GCOS criteria is met:

Weighted least square:

None %

Ordinary least square:

None %


Temporal anomaly analyis

The variance of the temporal anomalies provides an additional measure about the stability of the signal AFTER removal of the mean seasonal cylce.

+000 deg


+057/+063 deg