CAMPO_GRANDE


Location

lon / lat [deg]: -54.6167 / -20.45

Source network: AERONET


Geostationary surface albedo (GSA) data


“+000”


“+057/+063”


Landcover information (based on ESA CCI landcover data)


Landcover fractions @ 2km distance


Landcover fractions @ 20 km distance


Legend


Distance to open water bodies [km]:

16.25

Distance to urban areas [km]:

0.21


Radius: 1 km

Number of landcover classes:

1

Dominant landcover type:

190: urban areas

Fraction of dominant landcover type [%]:

100.0


Radius: 2 km

Number of landcover classes:

1

Dominant landcover type:

190: urban areas

Fraction of dominant landcover type [%]:

100.0


Radius: 5 km

Number of landcover classes:

2

Dominant landcover type:

190: urban areas

Fraction of dominant landcover type [%]:

97.0


Radius: 10 km

Number of landcover classes:

2

Dominant landcover type:

190: urban areas

Fraction of dominant landcover type [%]:

69.0


Radius: 20 km

Number of landcover classes:

4

Dominant landcover type:

10: cropland, rainfed

Fraction of dominant landcover type [%]:

73.0


Disturbances


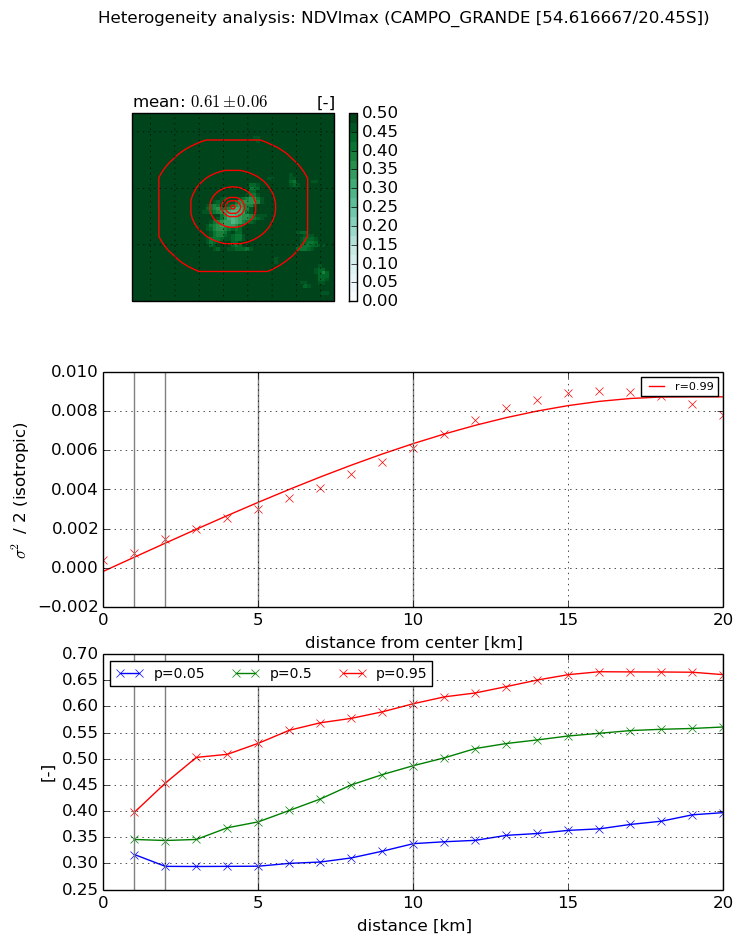
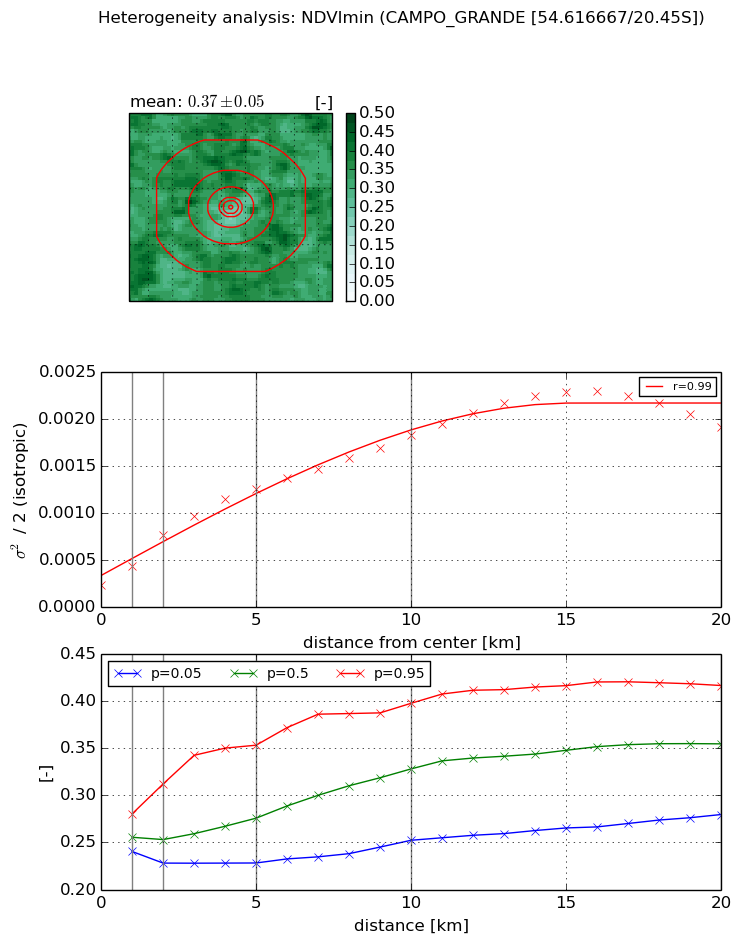
Heterogeneity analysis

The heterogeneity analysis provides information about the spatial and temporal heterogeneity of the site.

Topography


Roman et al. (2009) index


St

16.8386505033

Rcv

0.105084654536

Rse

0.0

Rst

-0.0387008434117

Rsv

0.034376047683


Height range @ 1km [m]

73

Height range @ 2km [m]

81

Height range @ 5km [m]

104

Height range @ 10km [m]

-999

Height range @ 20km [m]

-999


Variance slope @ 1 km

225

Variance slope @ 2 km

279

Variance slope @ 5 km

240

Variance slope @ 10 km

-999

Variance slope @ 20 km

-999


NDVI (max. NDVI composite)


Roman et al. (2009) index


St

2.64985845047

Rcv

-0.0237369398384

Rse

0.0

Rst

-0.108399264011

Rsv

-0.999999740798


NDVI range @ 1km [-]

0.08

NDVI range @ 2km [-]

0.16

NDVI range @ 5km [-]

0.24

NDVI range @ 10km [-]

0.27

NDVI range @ 20km [-]

0.26


Variance slope @ 1 km

0.000369042862426

Variance slope @ 2 km

0.000533264357331

Variance slope @ 5 km

0.000533639016732

Variance slope @ 10 km

0.000565275884254

Variance slope @ 20 km

0.000463612637006


NDVI (min. NDVI composite)I


Roman et al. (2009) index


St

2.67502002945

Rcv

0.0164880988694

Rse

0.0

Rst

-0.104999301828

Rsv

-0.999999529109


NDVI range @ 1km [-]

0.04

NDVI range @ 2km [-]

0.08

NDVI range @ 5km [-]

0.13

NDVI range @ 10km [-]

0.15

NDVI range @ 20km [-]

0.14


NDVI slope @ 1 km

0.000199054967078

NDVI slope @ 2 km

0.000265352350621

NDVI slope @ 5 km

0.000211847498601

NDVI slope @ 10 km

0.000151342025288

NDVI slope @ 20 km

9.10953151015e-05


Temporal stability analysis

+000 deg (BHR)


BHR statistics

Temporal stability [1/decade]:


abs

rel


Weighted least square:

-99999.0


Ordinary least square:

-99999.0


Probabilities that GCOS criteria is met:

Weighted least square:

-99999.0 %

Ordinary least square:

-99999.0 %


DHR statistics

Temporal stability [1/decade]:


abs

rel


Weighted least square:

-99999.0


Ordinary least square:

-99999.0


Probabilities that GCOS criteria is met:

Weighted least square:

-99999.0 %

Ordinary least square:

-99999.0 %


+057/+063 deg (BHR)


BHR statistics

Temporal stability [1/decade]:


abs

rel


Weighted least square:

None


Ordinary least square:

None


Probabilities that GCOS criteria is met:

Weighted least square:

None %

Ordinary least square:

None %


DHR statistics

Temporal stability [1/decade]:


abs

rel


Weighted least square:

None


Ordinary least square:

None


Probabilities that GCOS criteria is met:

Weighted least square:

None %

Ordinary least square:

None %


Temporal anomaly analyis

The variance of the temporal anomalies provides an additional measure about the stability of the signal AFTER removal of the mean seasonal cylce.

+000 deg


+057/+063 deg