CAMPO_VERDE


Location

lon / lat [deg]: -55.175 / -15.5617

Source network: AERONET


Geostationary surface albedo (GSA) data


“+000”


“+057/+063”


Landcover information (based on ESA CCI landcover data)


Landcover fractions @ 2km distance


Landcover fractions @ 20 km distance


Legend


Distance to open water bodies [km]:

20.4

Distance to urban areas [km]:

0.46


Radius: 1 km

Number of landcover classes:

2

Dominant landcover type:

10: cropland, rainfed

Fraction of dominant landcover type [%]:

66.0


Radius: 2 km

Number of landcover classes:

2

Dominant landcover type:

10: cropland, rainfed

Fraction of dominant landcover type [%]:

57.0


Radius: 5 km

Number of landcover classes:

3

Dominant landcover type:

10: cropland, rainfed

Fraction of dominant landcover type [%]:

85.0


Radius: 10 km

Number of landcover classes:

4

Dominant landcover type:

10: cropland, rainfed

Fraction of dominant landcover type [%]:

86.0


Radius: 20 km

Number of landcover classes:

3

Dominant landcover type:

10: cropland, rainfed

Fraction of dominant landcover type [%]:

86.0


Disturbances


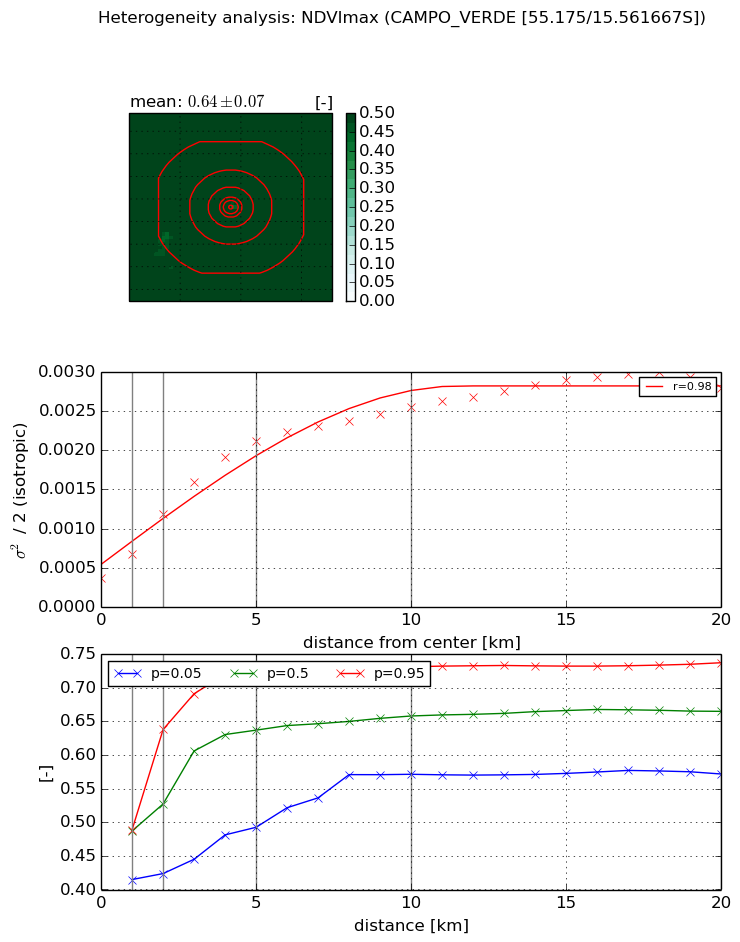
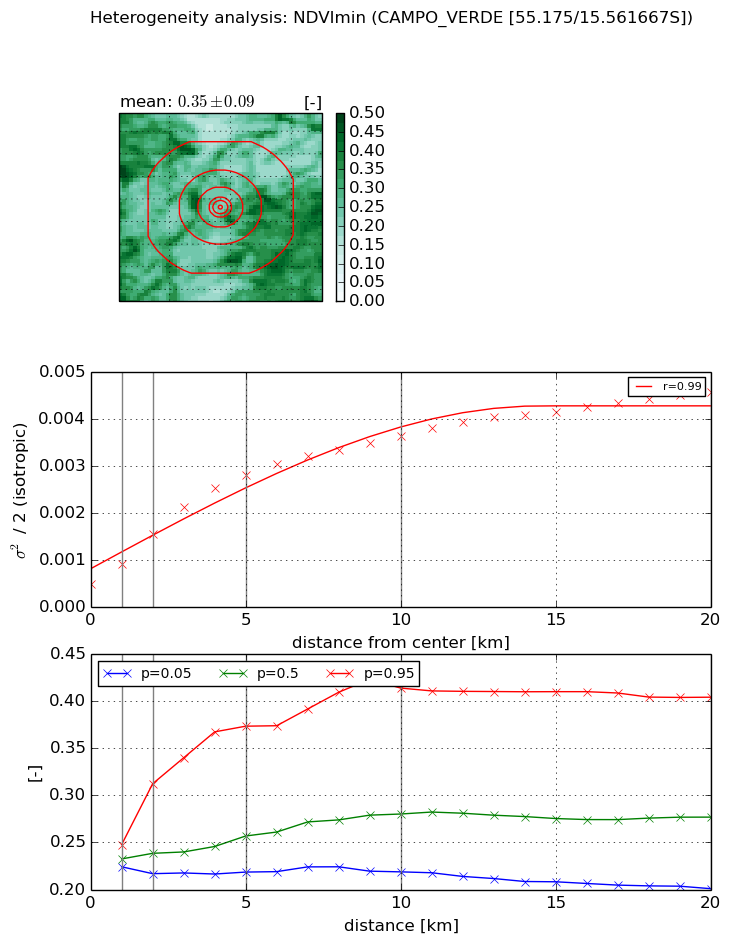
Heterogeneity analysis

The heterogeneity analysis provides information about the spatial and temporal heterogeneity of the site.

Topography


Roman et al. (2009) index


St

4.86738427573

Rcv

0.192570997563

Rse

0.0

Rst

-0.0421865234043

Rsv

0.381589952349


Height range @ 1km [m]

27

Height range @ 2km [m]

60

Height range @ 5km [m]

71

Height range @ 10km [m]

-999

Height range @ 20km [m]

-999


Variance slope @ 1 km

232

Variance slope @ 2 km

242

Variance slope @ 5 km

152

Variance slope @ 10 km

-999

Variance slope @ 20 km

-999


NDVI (max. NDVI composite)


Roman et al. (2009) index


St

7.13444593997

Rcv

-0.264842729431

Rse

0.0

Rst

-0.0320966335647

Rsv

0.123555798821


NDVI range @ 1km [-]

0.07

NDVI range @ 2km [-]

0.21

NDVI range @ 5km [-]

0.22

NDVI range @ 10km [-]

0.16

NDVI range @ 20km [-]

0.17


Variance slope @ 1 km

0.000309059908523

Variance slope @ 2 km

0.000404207156139

Variance slope @ 5 km

0.000366633329537

Variance slope @ 10 km

0.000211771999269

Variance slope @ 20 km

0.00010809022862


NDVI (min. NDVI composite)I


Roman et al. (2009) index


St

2.9755242887e-06

Rcv

0.0535133499354

Rse

0.0

Rst

0.297844936691

Rsv

1008225.32887


NDVI range @ 1km [-]

0.02

NDVI range @ 2km [-]

0.1

NDVI range @ 5km [-]

0.16

NDVI range @ 10km [-]

0.2

NDVI range @ 20km [-]

0.2


NDVI slope @ 1 km

0.000423223075751

NDVI slope @ 2 km

0.000533339916114

NDVI slope @ 5 km

0.000482909350314

NDVI slope @ 10 km

0.000309369569386

NDVI slope @ 20 km

0.000177211416812


Temporal stability analysis

+000 deg (BHR)


BHR statistics

Temporal stability [1/decade]:


abs

rel


Weighted least square:

-99999.0


Ordinary least square:

-99999.0


Probabilities that GCOS criteria is met:

Weighted least square:

-99999.0 %

Ordinary least square:

-99999.0 %


DHR statistics

Temporal stability [1/decade]:


abs

rel


Weighted least square:

-99999.0


Ordinary least square:

-99999.0


Probabilities that GCOS criteria is met:

Weighted least square:

-99999.0 %

Ordinary least square:

-99999.0 %


+057/+063 deg (BHR)


BHR statistics

Temporal stability [1/decade]:


abs

rel


Weighted least square:

None


Ordinary least square:

None


Probabilities that GCOS criteria is met:

Weighted least square:

None %

Ordinary least square:

None %


DHR statistics

Temporal stability [1/decade]:


abs

rel


Weighted least square:

None


Ordinary least square:

None


Probabilities that GCOS criteria is met:

Weighted least square:

None %

Ordinary least square:

None %


Temporal anomaly analyis

The variance of the temporal anomalies provides an additional measure about the stability of the signal AFTER removal of the mean seasonal cylce.

+000 deg


+057/+063 deg