CANDLE_LAKE


Location

lon / lat [deg]: -105.267 / 53.733

Source network: AERONET


Geostationary surface albedo (GSA) data


“+000”


“+057/+063”


Landcover information (based on ESA CCI landcover data)


Landcover fractions @ 2km distance


Landcover fractions @ 20 km distance


Legend


Distance to open water bodies [km]:

0.14

Distance to urban areas [km]:

55.34


Radius: 1 km

Number of landcover classes:

3

Dominant landcover type:

210: water bodies

Fraction of dominant landcover type [%]:

64.0


Radius: 2 km

Number of landcover classes:

6

Dominant landcover type:

210: water bodies

Fraction of dominant landcover type [%]:

57.0


Radius: 5 km

Number of landcover classes:

6

Dominant landcover type:

70: Tree cover, needleleaved, evergreen, closed to open (>15%)

Fraction of dominant landcover type [%]:

54.0


Radius: 10 km

Number of landcover classes:

8

Dominant landcover type:

70: Tree cover, needleleaved, evergreen, closed to open (>15%)

Fraction of dominant landcover type [%]:

62.0


Radius: 20 km

Number of landcover classes:

8

Dominant landcover type:

70: Tree cover, needleleaved, evergreen, closed to open (>15%)

Fraction of dominant landcover type [%]:

74.0


Disturbances


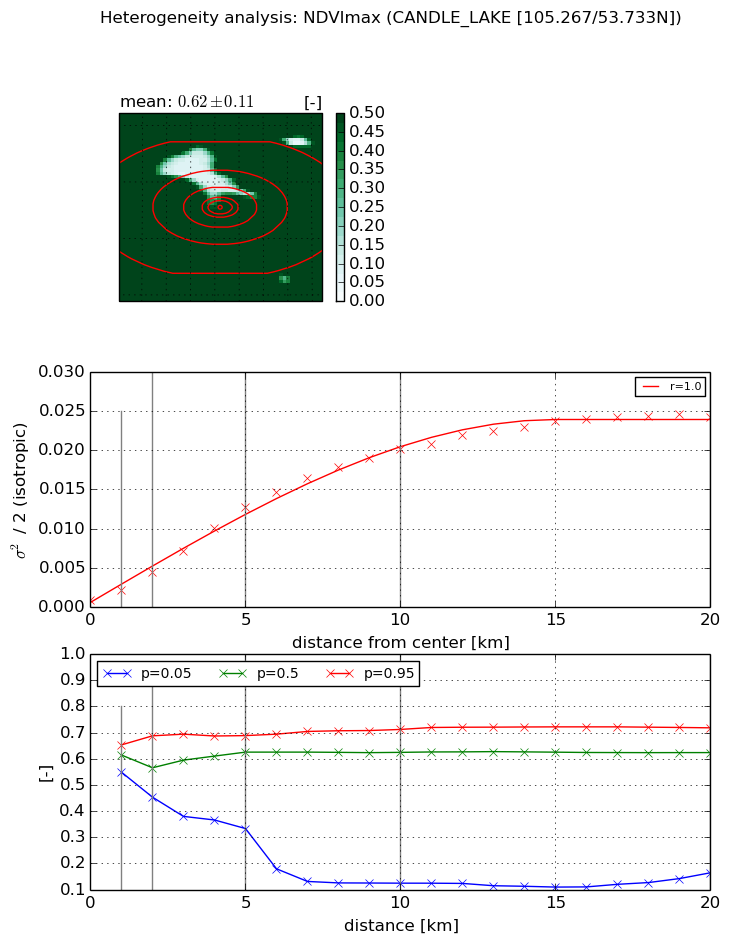
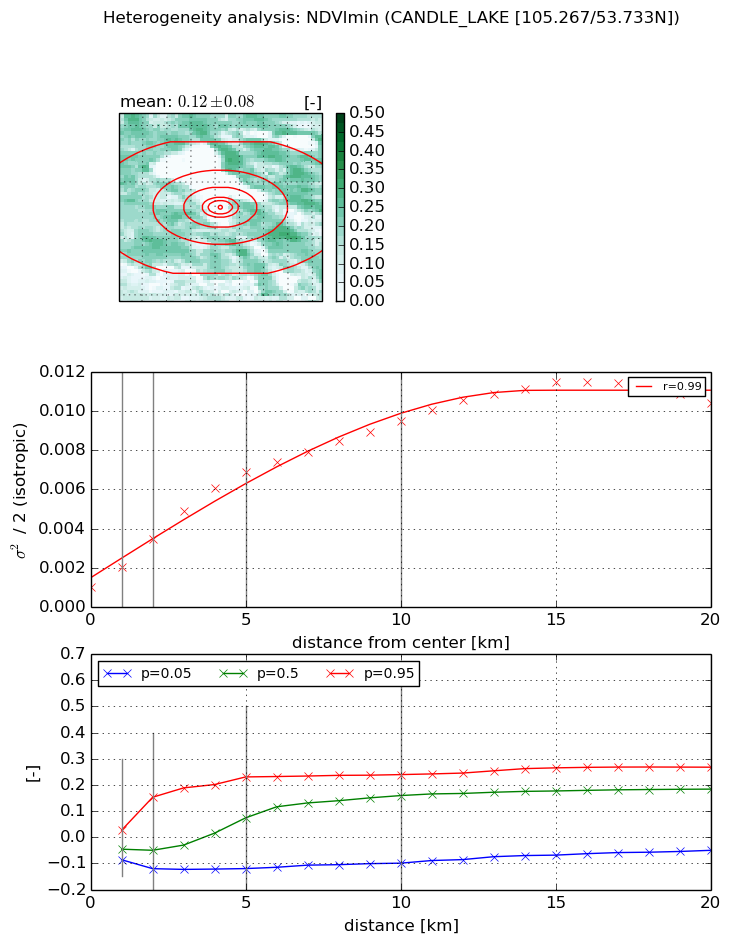
Heterogeneity analysis

The heterogeneity analysis provides information about the spatial and temporal heterogeneity of the site.

Topography


Roman et al. (2009) index


St

5.94890674114

Rcv

0.220119217469

Rse

0.0

Rst

0.0414663222031

Rsv

0.242708800539


Height range @ 1km [m]

18

Height range @ 2km [m]

20

Height range @ 5km [m]

25

Height range @ 10km [m]

-999

Height range @ 20km [m]

-999


Variance slope @ 1 km

21

Variance slope @ 2 km

22

Variance slope @ 5 km

21

Variance slope @ 10 km

-999

Variance slope @ 20 km

-999


NDVI (max. NDVI composite)


Roman et al. (2009) index


St

2.31940222211

Rcv

0.181052536451

Rse

0.0

Rst

-0.112384270948

Rsv

-0.99999991151


NDVI range @ 1km [-]

0.1

NDVI range @ 2km [-]

0.23

NDVI range @ 5km [-]

0.36

NDVI range @ 10km [-]

0.59

NDVI range @ 20km [-]

0.55


Variance slope @ 1 km

0.00130607782221

Variance slope @ 2 km

0.0017823718143

Variance slope @ 5 km

0.00244756256615

Variance slope @ 10 km

0.00206806913268

Variance slope @ 20 km

0.00118701252187


NDVI (min. NDVI composite)I


Roman et al. (2009) index


St

3.03503152143

Rcv

-0.905434968053

Rse

0.0

Rst

-0.0421101543024

Rsv

0.0409124863452


NDVI range @ 1km [-]

0.11

NDVI range @ 2km [-]

0.27

NDVI range @ 5km [-]

0.35

NDVI range @ 10km [-]

0.34

NDVI range @ 20km [-]

0.32


NDVI slope @ 1 km

0.0010457049603

NDVI slope @ 2 km

0.00124436686717

NDVI slope @ 5 km

0.00122691707429

NDVI slope @ 10 km

0.000840537024913

NDVI slope @ 20 km

0.000473369759914


Temporal stability analysis

+000 deg (BHR)


BHR statistics

Temporal stability [1/decade]:


abs

rel


Weighted least square:

None


Ordinary least square:

None


Probabilities that GCOS criteria is met:

Weighted least square:

None %

Ordinary least square:

None %


DHR statistics

Temporal stability [1/decade]:


abs

rel


Weighted least square:

None


Ordinary least square:

None


Probabilities that GCOS criteria is met:

Weighted least square:

None %

Ordinary least square:

None %


+057/+063 deg (BHR)


BHR statistics

Temporal stability [1/decade]:


abs

rel


Weighted least square:

None


Ordinary least square:

None


Probabilities that GCOS criteria is met:

Weighted least square:

None %

Ordinary least square:

None %


DHR statistics

Temporal stability [1/decade]:


abs

rel


Weighted least square:

None


Ordinary least square:

None


Probabilities that GCOS criteria is met:

Weighted least square:

None %

Ordinary least square:

None %


Temporal anomaly analyis

The variance of the temporal anomalies provides an additional measure about the stability of the signal AFTER removal of the mean seasonal cylce.

+000 deg


+057/+063 deg