CEDAR_CREEK_ECOSYSTEM_SCIENCE_RESERVE_CDR


Location

lon / lat [deg]: -93.2 / 45.4

Source network: LTER


Geostationary surface albedo (GSA) data


“+000”


“+057/+063”


Landcover information (based on ESA CCI landcover data)


Landcover fractions @ 2km distance


Landcover fractions @ 20 km distance


Legend


Distance to open water bodies [km]:

0.95

Distance to urban areas [km]:

1.79


Radius: 1 km

Number of landcover classes:

7

Dominant landcover type:

60: Tree cover, broadleaved, decidous

Fraction of dominant landcover type [%]:

25.0


Radius: 2 km

Number of landcover classes:

8

Dominant landcover type:

130: grassland

Fraction of dominant landcover type [%]:

34.0


Radius: 5 km

Number of landcover classes:

11

Dominant landcover type:

130: grassland

Fraction of dominant landcover type [%]:

44.0


Radius: 10 km

Number of landcover classes:

10

Dominant landcover type:

130: grassland

Fraction of dominant landcover type [%]:

41.0


Radius: 20 km

Number of landcover classes:

10

Dominant landcover type:

130: grassland

Fraction of dominant landcover type [%]:

44.0


Disturbances


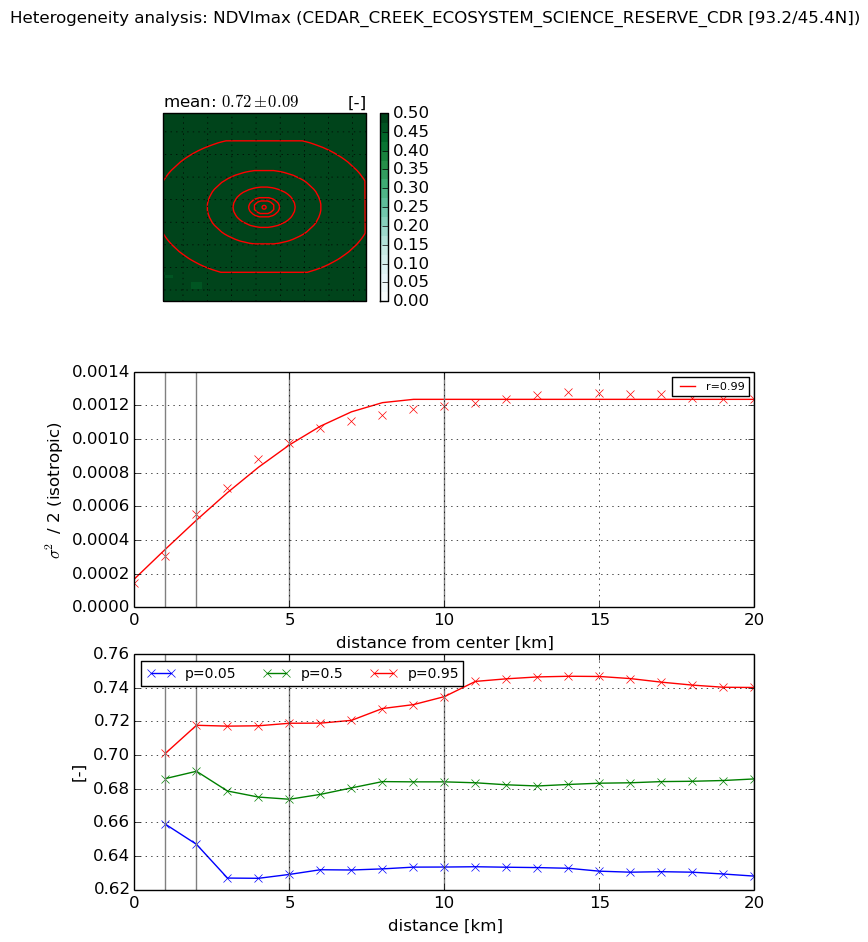
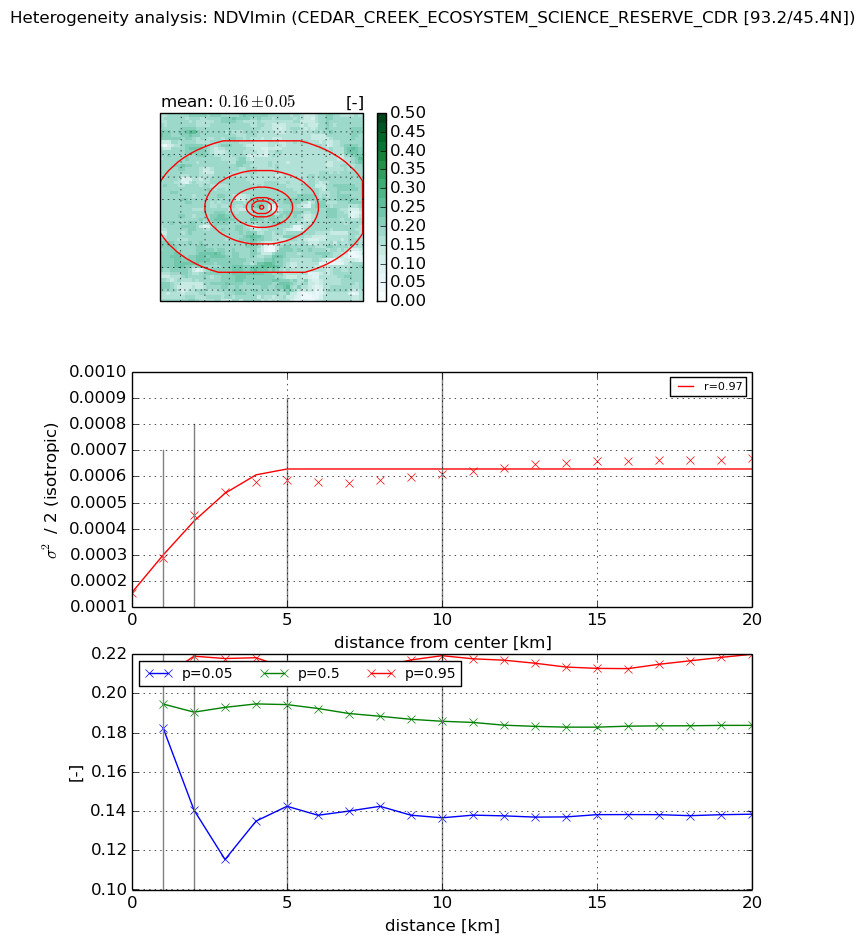
Heterogeneity analysis

The heterogeneity analysis provides information about the spatial and temporal heterogeneity of the site.

Topography


Roman et al. (2009) index


St

1.60602871976

Rcv

-0.0454099393191

Rse

0.0

Rst

-0.336195478916

Rsv

1.48635619608


Height range @ 1km [m]

15

Height range @ 2km [m]

14

Height range @ 5km [m]

12

Height range @ 10km [m]

-999

Height range @ 20km [m]

-999


Variance slope @ 1 km

8

Variance slope @ 2 km

3

Variance slope @ 5 km

1

Variance slope @ 10 km

-999

Variance slope @ 20 km

-999


NDVI (max. NDVI composite)


Roman et al. (2009) index


St

1.98704331735

Rcv

0.0318787239302

Rse

0.0

Rst

-0.477905249159

Rsv

-0.999996902752


NDVI range @ 1km [-]

0.04

NDVI range @ 2km [-]

0.07

NDVI range @ 5km [-]

0.09

NDVI range @ 10km [-]

0.1

NDVI range @ 20km [-]

0.11


Variance slope @ 1 km

0.000160891655199

Variance slope @ 2 km

0.000203468221626

Variance slope @ 5 km

0.000173172637539

Variance slope @ 10 km

0.00010460627809

Variance slope @ 20 km

4.42759675126e-05


NDVI (min. NDVI composite)I


Roman et al. (2009) index


St

4.96966326233

Rcv

-0.280907779835

Rse

0.0

Rst

0.0842397526788

Rsv

-0.238515098461


NDVI range @ 1km [-]

0.03

NDVI range @ 2km [-]

0.08

NDVI range @ 5km [-]

0.07

NDVI range @ 10km [-]

0.08

NDVI range @ 20km [-]

0.08


NDVI slope @ 1 km

0.000133506524232

NDVI slope @ 2 km

0.000149288926979

NDVI slope @ 5 km

8.92293174801e-05

NDVI slope @ 10 km

3.62433729391e-05

NDVI slope @ 20 km

1.62944075575e-05


Temporal stability analysis

+000 deg (BHR)


BHR statistics

Temporal stability [1/decade]:


abs

rel


Weighted least square:

None


Ordinary least square:

None


Probabilities that GCOS criteria is met:

Weighted least square:

None %

Ordinary least square:

None %


DHR statistics

Temporal stability [1/decade]:


abs

rel


Weighted least square:

None


Ordinary least square:

None


Probabilities that GCOS criteria is met:

Weighted least square:

None %

Ordinary least square:

None %


+057/+063 deg (BHR)


BHR statistics

Temporal stability [1/decade]:


abs

rel


Weighted least square:

None


Ordinary least square:

None


Probabilities that GCOS criteria is met:

Weighted least square:

None %

Ordinary least square:

None %


DHR statistics

Temporal stability [1/decade]:


abs

rel


Weighted least square:

None


Ordinary least square:

None


Probabilities that GCOS criteria is met:

Weighted least square:

None %

Ordinary least square:

None %


Temporal anomaly analyis

The variance of the temporal anomalies provides an additional measure about the stability of the signal AFTER removal of the mean seasonal cylce.

+000 deg


+057/+063 deg