CEILAP-BARILOCHE


Location

lon / lat [deg]: -71.1633 / -41.1469

Source network: AERONET


Geostationary surface albedo (GSA) data


“+000”


“+057/+063”


Landcover information (based on ESA CCI landcover data)


Landcover fractions @ 2km distance


Landcover fractions @ 20 km distance


Legend


Distance to open water bodies [km]:

5.66

Distance to urban areas [km]:

0.5


Radius: 1 km

Number of landcover classes:

4

Dominant landcover type:

120: Shrubland

Fraction of dominant landcover type [%]:

65.0


Radius: 2 km

Number of landcover classes:

5

Dominant landcover type:

120: Shrubland

Fraction of dominant landcover type [%]:

44.0


Radius: 5 km

Number of landcover classes:

9

Dominant landcover type:

120: Shrubland

Fraction of dominant landcover type [%]:

37.0


Radius: 10 km

Number of landcover classes:

9

Dominant landcover type:

120: Shrubland

Fraction of dominant landcover type [%]:

32.0


Radius: 20 km

Number of landcover classes:

11

Dominant landcover type:

120: Shrubland

Fraction of dominant landcover type [%]:

27.0


Disturbances


Heterogeneity analysis

The heterogeneity analysis provides information about the spatial and temporal heterogeneity of the site.

Topography


Roman et al. (2009) index


St

0.000284932715584

Rcv

3.2206286744

Rse

0.0

Rst

-0.0226930489198

Rsv

10525.5581669


Height range @ 1km [m]

15

Height range @ 2km [m]

27

Height range @ 5km [m]

131

Height range @ 10km [m]

-999

Height range @ 20km [m]

-999


Variance slope @ 1 km

991

Variance slope @ 2 km

1169

Variance slope @ 5 km

808

Variance slope @ 10 km

-999

Variance slope @ 20 km

-999


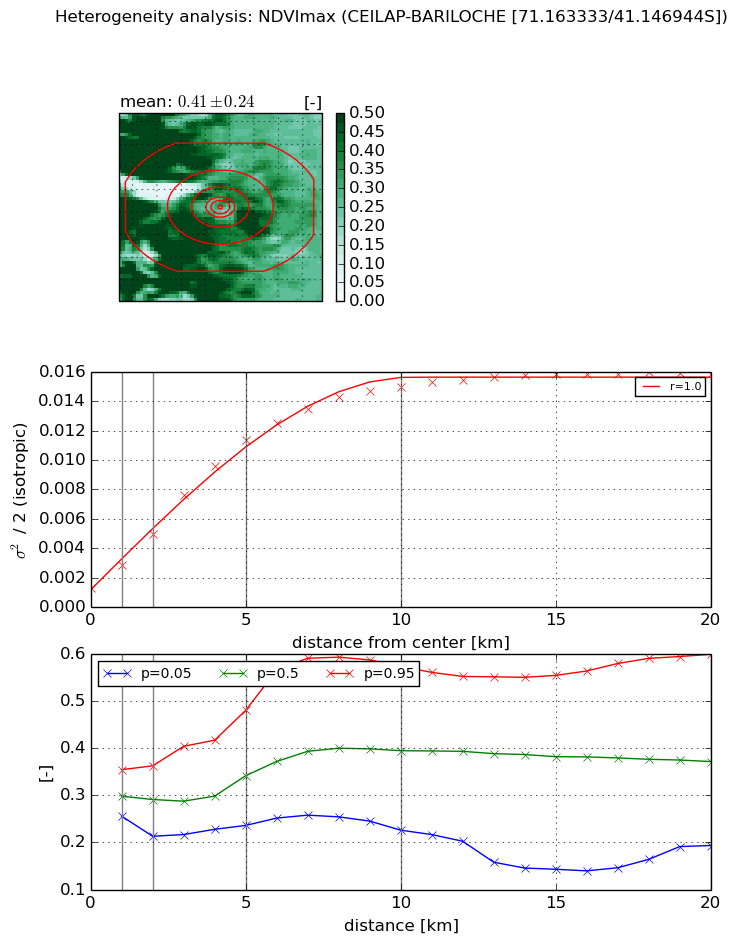
NDVI (max. NDVI composite)


Roman et al. (2009) index


St

3.13199123802

Rcv

0.288493325757

Rse

0.0

Rst

-0.14036514014

Rsv

0.528998619901


NDVI range @ 1km [-]

0.1

NDVI range @ 2km [-]

0.15

NDVI range @ 5km [-]

0.24

NDVI range @ 10km [-]

0.35

NDVI range @ 20km [-]

0.41


Variance slope @ 1 km

0.00155110755043

Variance slope @ 2 km

0.00184976750431

Variance slope @ 5 km

0.00208758150594

Variance slope @ 10 km

0.00143877029051

Variance slope @ 20 km

0.000637802171931


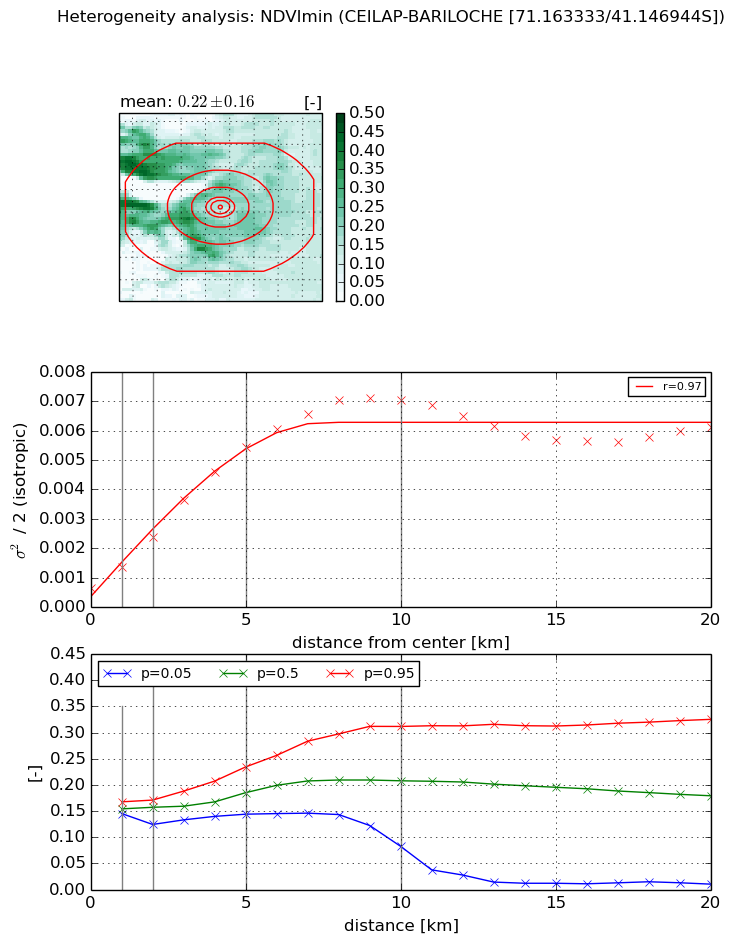
NDVI (min. NDVI composite)I


Roman et al. (2009) index


St

2.65085234484

Rcv

0.539368322903

Rse

0.0

Rst

-0.155760435361

Rsv

0.436582710252


NDVI range @ 1km [-]

0.02

NDVI range @ 2km [-]

0.05

NDVI range @ 5km [-]

0.09

NDVI range @ 10km [-]

0.23

NDVI range @ 20km [-]

0.32


NDVI slope @ 1 km

0.000713982380299

NDVI slope @ 2 km

0.000865195958514

NDVI slope @ 5 km

0.00100026598738

NDVI slope @ 10 km

0.000692072943425

NDVI slope @ 20 km

0.000183124285696


Temporal stability analysis

+000 deg (BHR)


BHR statistics

Temporal stability [1/decade]:


abs

rel


Weighted least square:

-99999.0


Ordinary least square:

-99999.0


Probabilities that GCOS criteria is met:

Weighted least square:

-99999.0 %

Ordinary least square:

-99999.0 %


DHR statistics

Temporal stability [1/decade]:


abs

rel


Weighted least square:

-99999.0


Ordinary least square:

-99999.0


Probabilities that GCOS criteria is met:

Weighted least square:

-99999.0 %

Ordinary least square:

-99999.0 %


+057/+063 deg (BHR)


BHR statistics

Temporal stability [1/decade]:


abs

rel


Weighted least square:

None


Ordinary least square:

None


Probabilities that GCOS criteria is met:

Weighted least square:

None %

Ordinary least square:

None %


DHR statistics

Temporal stability [1/decade]:


abs

rel


Weighted least square:

None


Ordinary least square:

None


Probabilities that GCOS criteria is met:

Weighted least square:

None %

Ordinary least square:

None %


Temporal anomaly analyis

The variance of the temporal anomalies provides an additional measure about the stability of the signal AFTER removal of the mean seasonal cylce.

+000 deg


+057/+063 deg