CEILAP-NEUQUEN


Location

lon / lat [deg]: -68.1367 / -38.9522

Source network: AERONET


Geostationary surface albedo (GSA) data


“+000”


“+057/+063”


Landcover information (based on ESA CCI landcover data)


Landcover fractions @ 2km distance


Landcover fractions @ 20 km distance


Legend


Distance to open water bodies [km]:

2.71

Distance to urban areas [km]:

0.12


Radius: 1 km

Number of landcover classes:

1

Dominant landcover type:

190: urban areas

Fraction of dominant landcover type [%]:

100.0


Radius: 2 km

Number of landcover classes:

2

Dominant landcover type:

190: urban areas

Fraction of dominant landcover type [%]:

98.0


Radius: 5 km

Number of landcover classes:

6

Dominant landcover type:

190: urban areas

Fraction of dominant landcover type [%]:

69.0


Radius: 10 km

Number of landcover classes:

4

Dominant landcover type:

190: urban areas

Fraction of dominant landcover type [%]:

49.0


Radius: 20 km

Number of landcover classes:

6

Dominant landcover type:

120: Shrubland

Fraction of dominant landcover type [%]:

63.0


Disturbances


Heterogeneity analysis

The heterogeneity analysis provides information about the spatial and temporal heterogeneity of the site.

Topography


Roman et al. (2009) index


St

4.86808832226e-06

Rcv

2.6640014756

Rse

0.0

Rst

0.0272173508408

Rsv

616255.642937


Height range @ 1km [m]

7

Height range @ 2km [m]

7

Height range @ 5km [m]

87

Height range @ 10km [m]

-999

Height range @ 20km [m]

-999


Variance slope @ 1 km

136

Variance slope @ 2 km

194

Variance slope @ 5 km

215

Variance slope @ 10 km

-999

Variance slope @ 20 km

-999


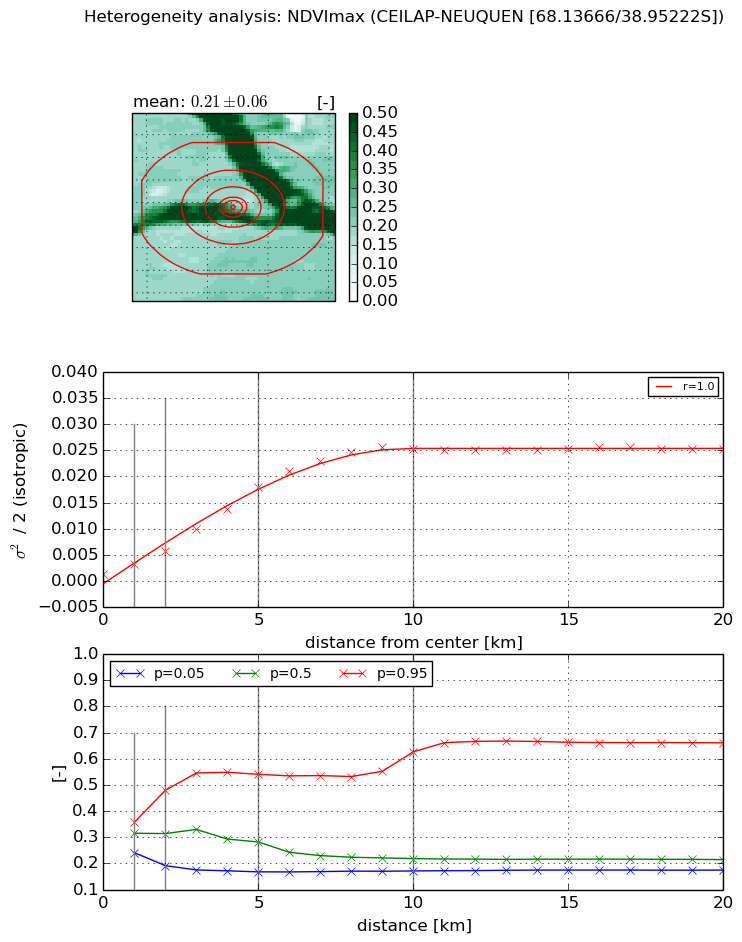
NDVI (max. NDVI composite)


Roman et al. (2009) index


St

1.76865858237

Rcv

0.131771447758

Rse

0.0

Rst

-0.0978203574207

Rsv

1.46660893696


NDVI range @ 1km [-]

0.12

NDVI range @ 2km [-]

0.29

NDVI range @ 5km [-]

0.37

NDVI range @ 10km [-]

0.46

NDVI range @ 20km [-]

0.49


Variance slope @ 1 km

0.00182936821859

Variance slope @ 2 km

0.00224245166746

Variance slope @ 5 km

0.00340633544137

Variance slope @ 10 km

0.00272273918494

Variance slope @ 20 km

0.00108356818672


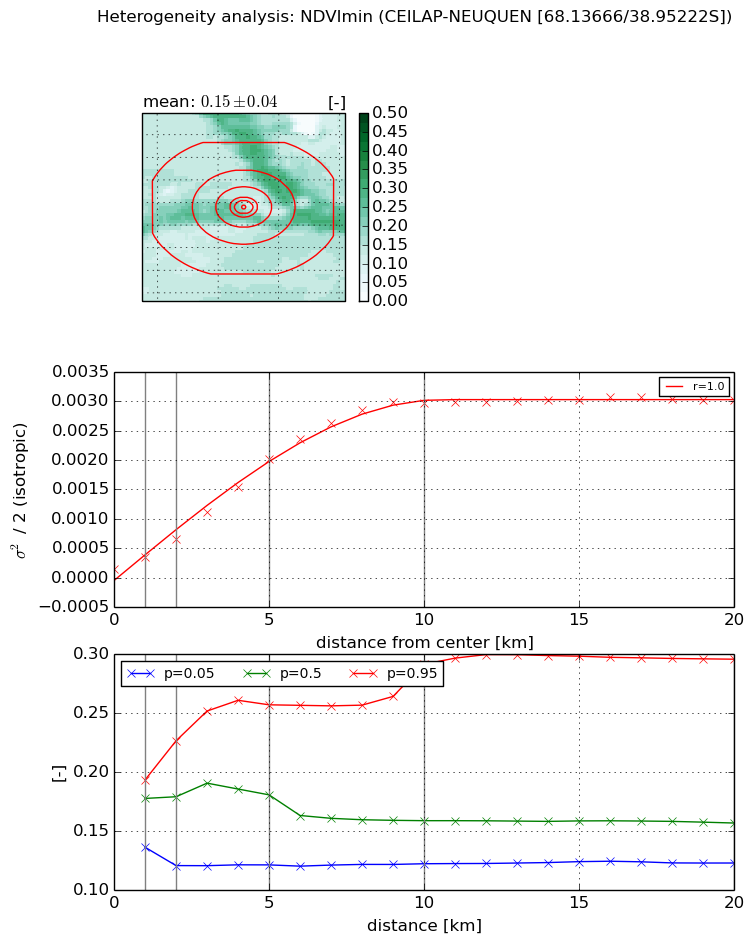
NDVI (min. NDVI composite)I


Roman et al. (2009) index


St

3.72771426647

Rcv

0.113167148277

Rse

0.0

Rst

-0.0600417230552

Rsv

0.631573841492


NDVI range @ 1km [-]

0.06

NDVI range @ 2km [-]

0.11

NDVI range @ 5km [-]

0.14

NDVI range @ 10km [-]

0.17

NDVI range @ 20km [-]

0.17


NDVI slope @ 1 km

0.000204722161113

NDVI slope @ 2 km

0.000252574959982

NDVI slope @ 5 km

0.000379302459693

NDVI slope @ 10 km

0.000318354037606

NDVI slope @ 20 km

0.000134587075228


Temporal stability analysis

+000 deg (BHR)


BHR statistics

Temporal stability [1/decade]:


abs

rel


Weighted least square:

-99999.0


Ordinary least square:

-99999.0


Probabilities that GCOS criteria is met:

Weighted least square:

-99999.0 %

Ordinary least square:

-99999.0 %


DHR statistics

Temporal stability [1/decade]:


abs

rel


Weighted least square:

-99999.0


Ordinary least square:

-99999.0


Probabilities that GCOS criteria is met:

Weighted least square:

-99999.0 %

Ordinary least square:

-99999.0 %


+057/+063 deg (BHR)


BHR statistics

Temporal stability [1/decade]:


abs

rel


Weighted least square:

None


Ordinary least square:

None


Probabilities that GCOS criteria is met:

Weighted least square:

None %

Ordinary least square:

None %


DHR statistics

Temporal stability [1/decade]:


abs

rel


Weighted least square:

None


Ordinary least square:

None


Probabilities that GCOS criteria is met:

Weighted least square:

None %

Ordinary least square:

None %


Temporal anomaly analyis

The variance of the temporal anomalies provides an additional measure about the stability of the signal AFTER removal of the mean seasonal cylce.

+000 deg


+057/+063 deg